Plane with an SDR#
Telemetry and radio data from one flight
Intro#
Upload a two-minute flight near Washington, DC, by a plane that carries a software-defined
radio (SDR). The plane is one Nominal asset with two
datasets: telemetry, the flight data, and sdr, the radio’s IQ samples. Both come from nbdemo.data: aero.flight_dc
is simulated telemetry, and rf.sigmf_synthetic is a SigMF recording,
IQEngine’s synthetic example by Marc
(CC BY 4.0), repeated to last as long as the
flight.
Requirements: a default profile
for the Nominal Python Client, and the packages the notebook imports, including nbdemo[all].
Running the notebooks explains how to set them up.
Each execution of the notebook reuses the asset. It archives what earlier executions created on it, so the asset holds one flight: this execution’s.
Setup#
A NominalClient connects to Nominal with the profile.
import numpy as np
import pandas as pd
from nominal.core import NominalClient, set_display_options
from nbdemo.data.aero import flight_dc
from nbdemo.data.rf import sigmf_synthetic
from nbdemo.style import set_plotly_style

# A Nominal object at the end of a cell displays as a card.
set_display_options(time_format="readable")
# Plotly figures use nbdemo's style, which suits both light and dark pages.
set_plotly_style()

client = NominalClient.from_profile("default")
Gather data#
Load the flight#
flight_dc.df has 120 seconds of telemetry at 10 Hz: a takeoff, a climb and three turns. Its timestamps are fixed, so shift them to end
now.
DURATION = 120  # seconds
RATE_HZ = 10  # telemetry samples per second

flight_start = pd.Timestamp.now(tz="UTC").floor("s") - pd.Timedelta(seconds=DURATION)
telemetry = flight_dc.df.copy()
# pandas reads the timestamps at microsecond resolution; Nominal takes nanoseconds.
telemetry.index = (flight_start + (telemetry.index - telemetry.index[0])).as_unit(
    "ns"
)
telemetry.round(2).head(5)
| latitude | longitude | altitude | heading | track | groundspeed | airspeed | vertical_speed | pitch | roll | throttle | engine_rpm | fuel | outside_air_temp | bus_voltage | |
|---|---|---|---|---|---|---|---|---|---|---|---|---|---|---|---|
| time | |||||||||||||||
| 2026-11-17 14:25:36.000+00:00 | 38.85 | -77.04 | 5.0 | 10.0 | 0.0 | 0.0 | 0.0 | 0.0 | 0.06 | -0.31 | 12.38 | 1042.11 | 80.0 | 21.90 | 13.76 |
| 2026-11-17 14:25:36.100+00:00 | 38.85 | -77.04 | 5.0 | 10.0 | 0.0 | 0.0 | 0.0 | 0.0 | 0.03 | -0.09 | 11.99 | 1015.20 | 80.0 | 22.04 | 13.82 |
| 2026-11-17 14:25:36.200+00:00 | 38.85 | -77.04 | 5.0 | 10.0 | 0.0 | 0.0 | 0.0 | 0.0 | 0.01 | 0.34 | 12.23 | 1015.11 | 80.0 | 22.02 | 13.77 |
| 2026-11-17 14:25:36.300+00:00 | 38.85 | -77.04 | 5.0 | 10.0 | 0.0 | 0.0 | 0.0 | 0.0 | 0.18 | -0.02 | 11.91 | 1017.79 | 80.0 | 22.06 | 13.80 |
| 2026-11-17 14:25:36.400+00:00 | 38.85 | -77.04 | 5.0 | 10.0 | 0.0 | 0.0 | 0.0 | 0.0 | -0.09 | -0.11 | 12.27 | 1033.48 | 80.0 | 22.02 | 13.81 |
Build the SDR data#
The recording is 1,000,000 complex samples at 480 kS/s. RATE_FACTOR scales the sample rate the
data is stamped with. At 1.0 the SDR runs at the recorded 480 kS/s, and the flight takes 57.6
million samples. At 0.05, the default, it runs at 24 kS/s and takes 2.9 million. The recording
repeats from the start as many times as it takes to cover the flight.
RATE_FACTOR = 0.05  # 1.0: the recorded sample rate; 0.05: one twentieth of it

recording = sigmf_synthetic.native  # a SigMFRecording, downloaded on first use
recorded_rate = float(recording.get_global_field("core:sample_rate"))
iq = recording.read_samples()  # complex samples

sdr_rate = recorded_rate * RATE_FACTOR  # samples per second
count = int(DURATION * sdr_rate)
samples = iq[np.arange(count) % len(iq)]  # repeat the recording to fill the flight
sdr_times = flight_start.value + np.round(np.arange(count) * 1e9 / sdr_rate).astype(
    "int64"
)
print(
    f"{count:,} samples at {sdr_rate:,.0f} S/s: "
    f"{count / len(iq):.1f} repeats of the {len(iq):,}-sample recording"
)
2,880,000 samples at 24,000 S/s: 2.9 repeats of the 1,000,000-sample recording
Preview the data#
Before uploading, check where the plane flew and what the radio heard. The map shows the flight’s ground track, with its start and end marked.
import plotly.express as px

# Open the map on the middle of the track, zoomed to fit the whole flight.
center = {"lat": telemetry["latitude"].mean(), "lon": telemetry["longitude"].mean()}
track = px.line_map(
    telemetry, lat="latitude", lon="longitude", center=center, zoom=12, height=380
)
ends = telemetry.iloc[[0, -1]]
track.add_scattermap(
    lat=ends["latitude"],
    lon=ends["longitude"],
    mode="markers+text",
    text=["start", "end"],
    textposition="top right",
    textfont={"color": "white"},
    marker={"size": 10},
    showlegend=False,
)
track.update_layout(
    map_style="carto-darkmatter", margin={"l": 0, "r": 0, "t": 0, "b": 0}
)
track
The first 400 IQ samples, in milliseconds from the start of the recording:
n = 400
iq_preview = pd.DataFrame(
    {"i": samples[:n].real, "q": samples[:n].imag},
    index=pd.Index(np.arange(n) / sdr_rate * 1e3, name="time (ms)"),
)
px.line(iq_preview)
Connect with Nominal#
Create the plane#
One asset, the plane, with a dataset
for each source. A run marks the flight, so both datasets can be opened for
the same time range.
plane = client.get_or_create_asset_by_properties(
    {"example": "flight_sdr"},
    name="Plane",
    description="A plane carrying a software-defined radio",
)
telemetry_dataset = plane.get_or_create_dataset(
    "telemetry",
    name="telemetry",
    description="Simulated flight data at 10 Hz",
)
sdr_dataset = plane.get_or_create_dataset(
    "sdr",
    name="sdr",
    description="IQ samples from the SDR: a SigMF recording, repeated",
)
run = plane.create_run(
    f"Flight over Washington, DC {flight_start:%Y-%m-%d %H:%M}",
    start=flight_start,
    end=flight_start + pd.Timedelta(seconds=DURATION),
    description="A two-minute flight with a takeoff, a climb and three turns",
)
plane
Asset(rid='ri.scout.cerulean-staging.asset.d25179f6-9b54-eaca-b6b4-0ac6d875886a', name='Plane', description='A plane carrying a software-defined radio', properties=mappingproxy({'example': 'flight_sdr'}), labels=(), created_at=1794495712704711000, is_archived=False)Upload#
Each channel goes through a write stream: one call per channel with every timestamp and value.
Closing the stream waits for the data to be sent.
telemetry_times = telemetry.index.astype("int64").to_numpy()
with telemetry_dataset.get_write_stream() as stream:
    for channel in telemetry.columns:
        stream.enqueue_batch(channel, telemetry_times, telemetry[channel].to_numpy())

with sdr_dataset.get_write_stream() as stream:
    stream.enqueue_batch("i", sdr_times, samples.real)
    stream.enqueue_batch("q", sdr_times, samples.imag)


UNITS = {
    "latitude": ("°", "Latitude, WGS 84"),
    "longitude": ("°", "Longitude, WGS 84"),
    "altitude": ("m", "Altitude above mean sea level"),
    "heading": ("°", "Direction the nose points, clockwise from north"),
    "track": ("°", "Direction of travel over the ground, clockwise from north"),
    "groundspeed": ("m/s", "Speed over the ground"),
    "airspeed": ("m/s", "Speed through the air"),
    "vertical_speed": ("m/s", "Rate of climb"),
    "pitch": ("°", "Nose up is positive"),
    "roll": ("°", "Right wing down is positive"),
    "throttle": ("%", "Throttle position"),
    "engine_rpm": ("rpm", "Engine speed"),
    "fuel": ("kg", "Fuel remaining"),
    "outside_air_temp": ("°C", "Outside air temperature"),
    "bus_voltage": ("V", "Electrical bus voltage"),
}
for channel in telemetry_dataset.get_channels():
    unit, description = UNITS[channel.name]
    channel.update(unit=unit, description=description)

run
Run(rid='ri.scout.cerulean-staging.run.45b050a7-fc49-7fb8-c553-d326a5dcdf0d', name='Flight over Washington, DC 2026-11-17 14:25', description='A two-minute flight with a takeoff, a climb and three turns', properties=mappingproxy({}), labels=(), links=(), start=1794925536000000000, end=1794925656000000000, run_number=508, assets=('ri.scout.cerulean-staging.asset.d25179f6-9b54-eaca-b6b4-0ac6d875886a',), created_at=1794925659570780000, is_archived=False)Example Prompt#
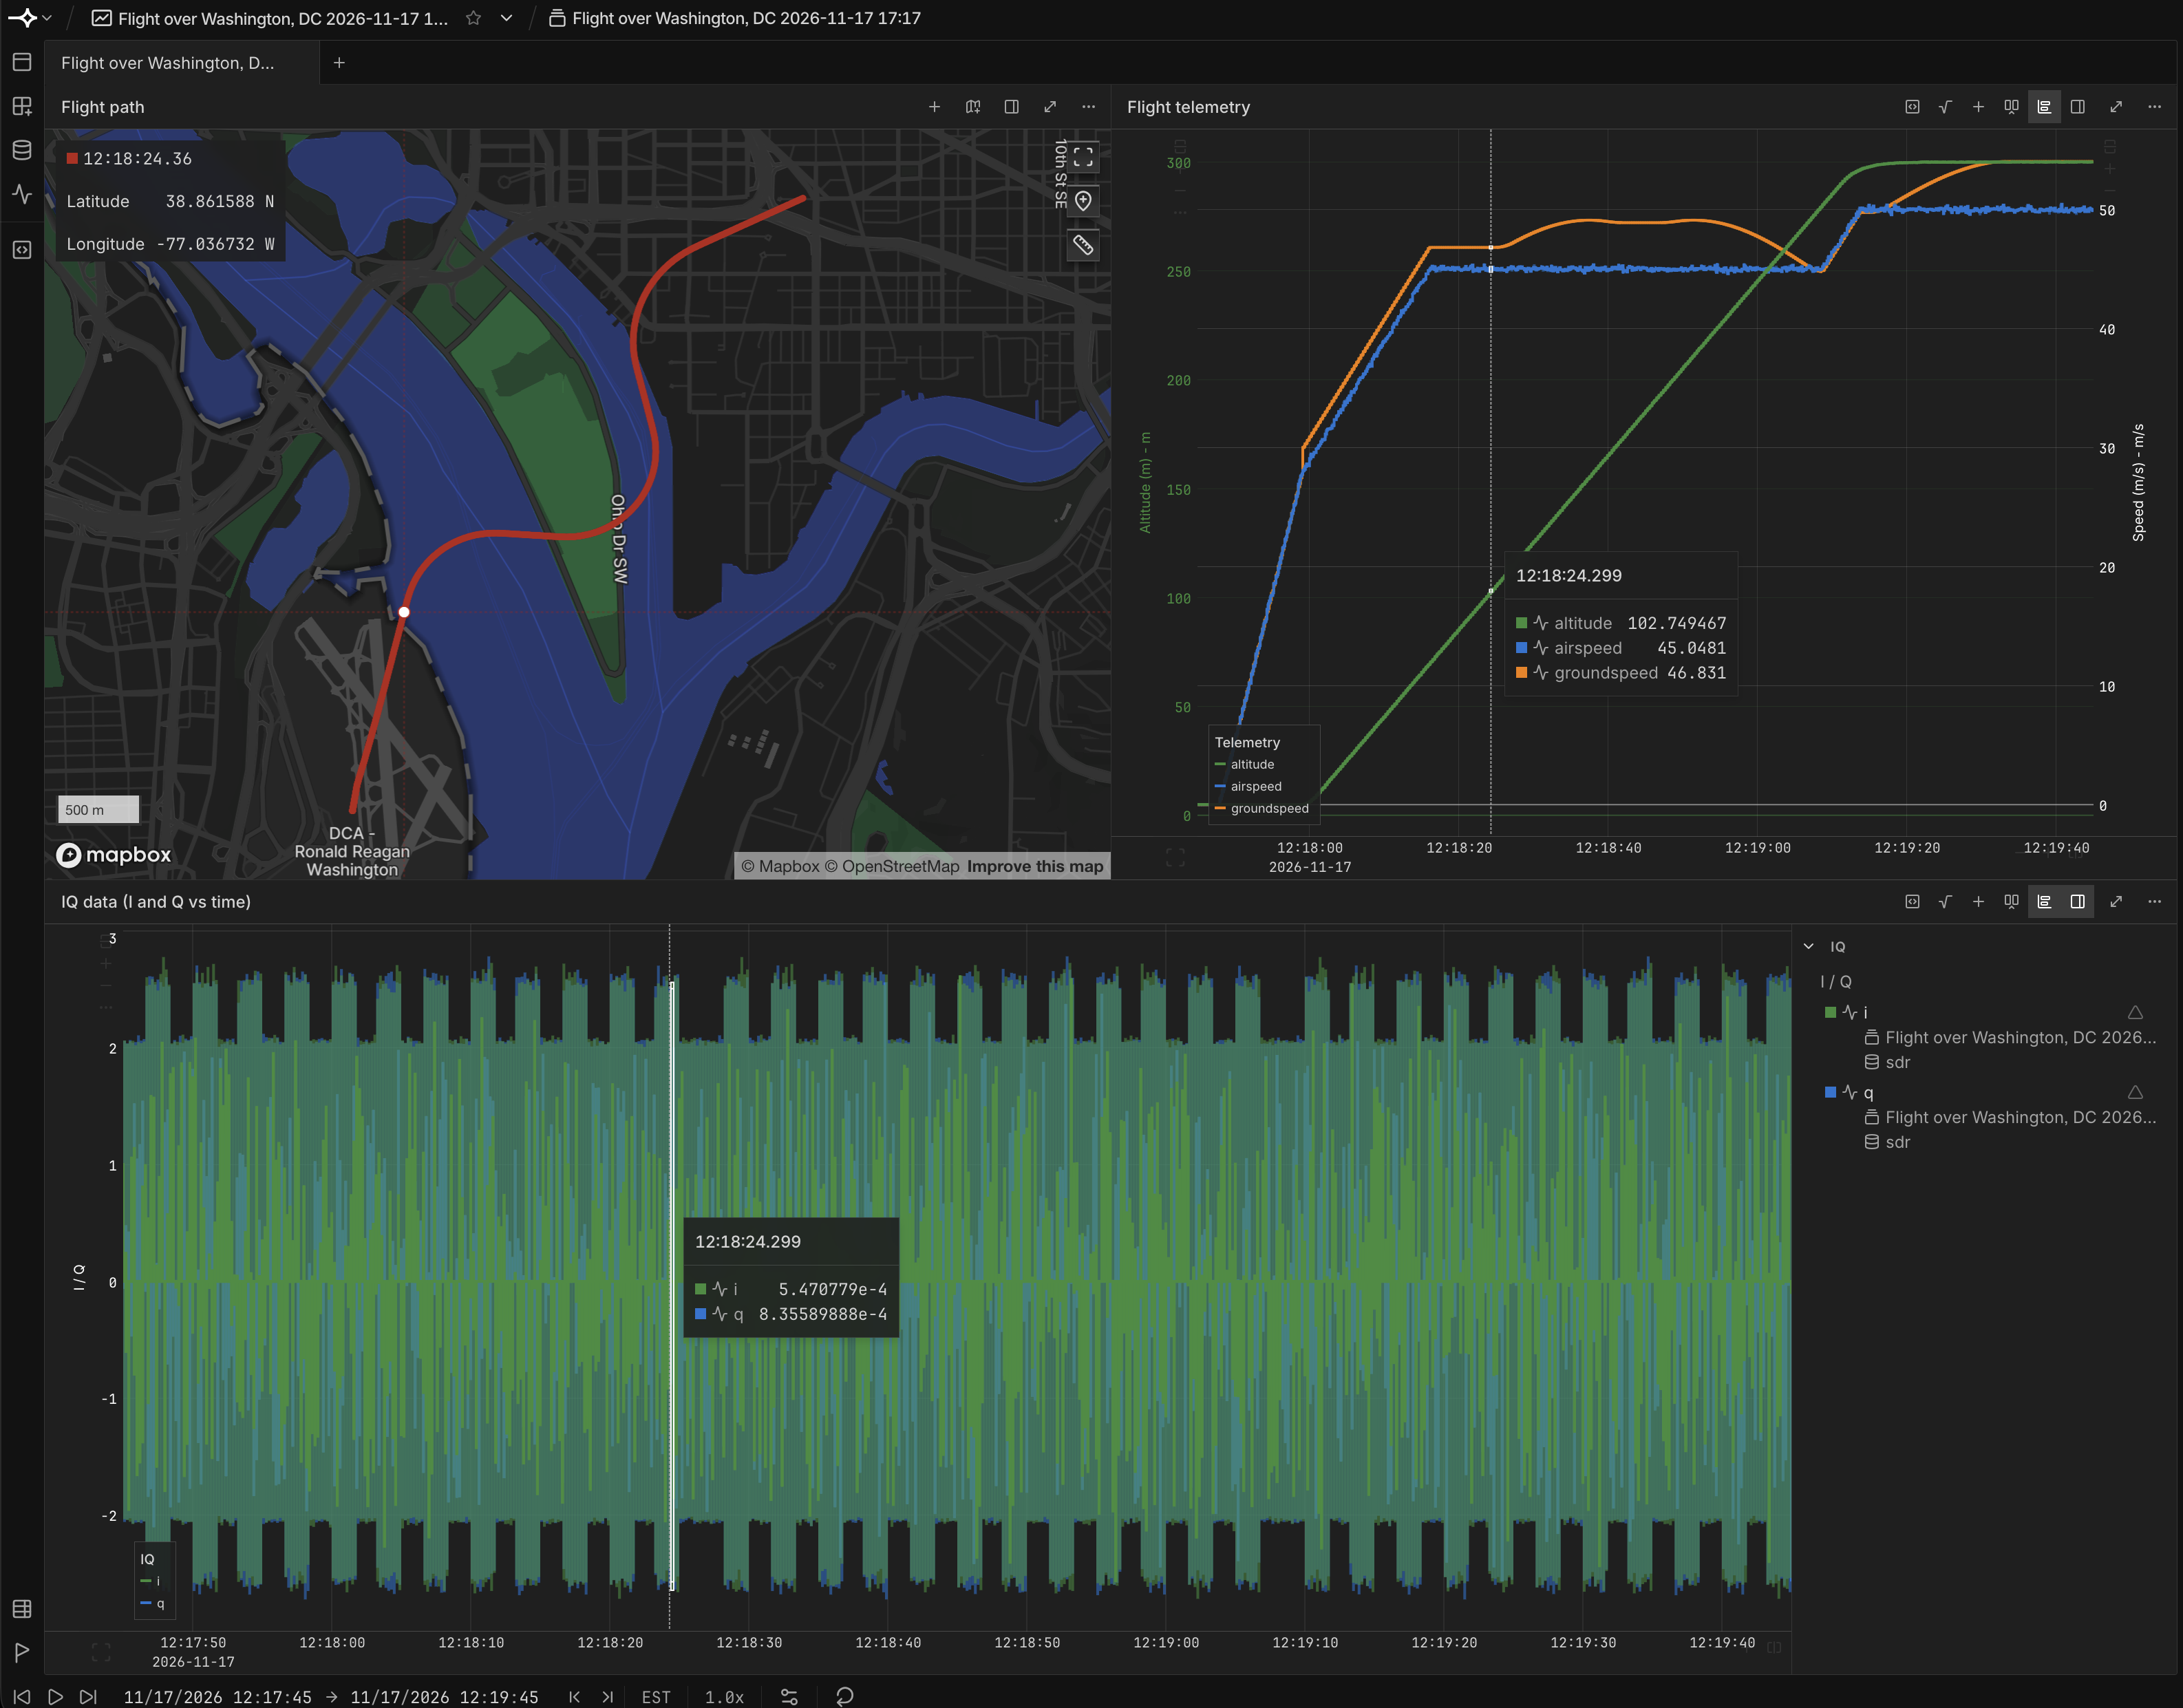
make a this notebook display
 * the flight on a map
 * a subset of the the telemetry on a plot
 * iq data on a separate chart: plot i and q vs time, full width on the bottom.