

Filtering and splitting by tag in a workbook#
Filter a workbook by tag to show only the points with certain values, or split by a tag to plot each value as its own series.
In the Nominal app#
To filter a single variable by tag with a transform, see 🔒︎Using variables with tags.
Filter by a tag#
Show only the points with certain tag values:
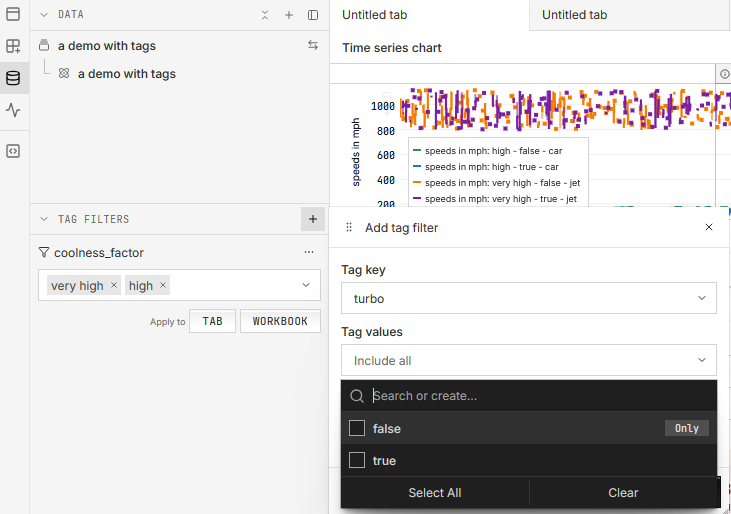
In the workbook’s left sidebar, click the Data icon to open the DATA panel.
In its TAG FILTERS section, click + (Add tag filter). Choose the Tag key, pick the values under Tag values, and click ADD TAG FILTER.
On the filter’s row, after Apply to, click TAB to filter every variable in the current tab, or WORKBOOK for every variable in the workbook.
Split by a tag#
Plot each tag value as its own series by splitting the variable that plots the channel:
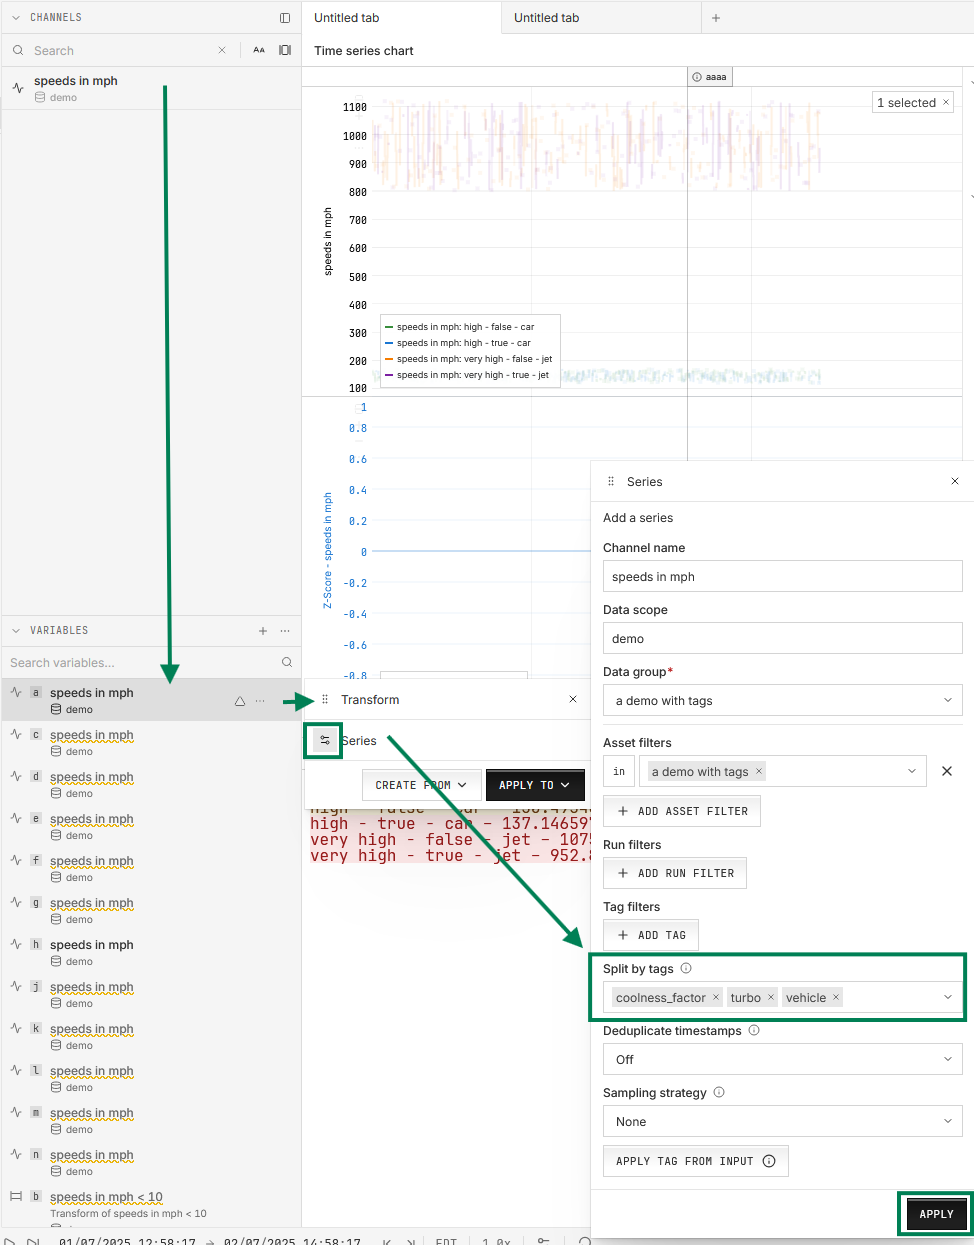
In the left sidebar’s Channels & variables view, find the VARIABLES section, hover over the variable, and click its Transform icon.
In the Transform window, click the settings icon on the Series row.
In the Series window, choose the tag under Split by tags, and click APPLY.
In code#
To filter by tag in code, pass the tags when you pull the data, as in Pull data into your code.