

Post-test analysis#
Story: “After a test I want to pull data, sometimes from several units, analyze the data in my language of choice, and upload the results back next to the original data.”
This page is for engineers who work with test data after the run, such as an analyst comparing results across tests, a design engineer fitting a model to measured behavior, or a data scientist crunching data from an entire test campaign.
Post-test analysis prerequisites#
Everything on this page starts from runs and assets. A run represents a test step, execution, or campaign, and an asset represents a unit under test or a test system. If your units don’t have assets yet, start from Organize and view your data. If tests that are already recorded don’t have runs, mark them after the fact.
A core tool in Nominal is the workbook, which can examine one run or asset on its own or compare it with others.
For example, with the default approach, a workbook reaches its data like this:
        ---
config:
  layout: elk

---
flowchart BT
    classDef green fill:#dcfce7,stroke:#15803d,color:#1f2937
    classDef red fill:#fee2e2,stroke:#b91c1c,color:#1f2937
    classDef purple fill:#e0e7ff,stroke:#4338ca,color:#1f2937
    classDef blue fill:#e0f2fe,stroke:#0369a1,color:#1f2937

    asset1["Asset: UUT1"]:::green
    dataset1[("Dataset<br>UUT1<br><br>Recorded channels")]:::purple
    dataset1 -->|"ref name=default"| asset1
    run1["Run: Test A"]:::red
    asset1 --> run1
    workbook1["Workbook<br><br>default.temperature"]:::blue
    run1 --> workbook1

    click asset1 href "../../../#asset" "Asset"
    click dataset1 href "../../../#time-series-data" "Time-series data"
    click run1 href "../../../#runs" "Runs"
    click workbook1 href "../../../../workbooks/" "Workbooks"
Once data has been analyzed, the results can also be stored in Nominal side-by-side with the raw data and workbooks can be used to refer to both the raw and processed data.
        ---
config:
  layout: elk

---
flowchart BT
    classDef green fill:#dcfce7,stroke:#15803d,color:#1f2937
    classDef red fill:#fee2e2,stroke:#b91c1c,color:#1f2937
    classDef purple fill:#e0e7ff,stroke:#4338ca,color:#1f2937
    classDef blue fill:#e0f2fe,stroke:#0369a1,color:#1f2937

    asset1["Asset: UUT1"]:::green
    dataset1[("Dataset<br>UUT1<br><br>Recorded channels")]:::purple
    dataset1 -->|"ref name=default"| asset1
    derived[("Dataset<br>UUT1 derived<br><br>Calculated channels")]:::purple
    derived -->|"ref name=derived"| asset1
    run1["Run: Test A"]:::red
    asset1 --> run1
    workbook1["Workbook<br><br>default.temperature<br>derived.temperature_avg"]:::blue
    run1 --> workbook1

    click asset1 href "../../../#asset" "Asset"
    click dataset1,derived href "../../../#time-series-data" "Time-series data"
    click run1 href "../../../#runs" "Runs"
    click workbook1 href "../../../../workbooks/" "Workbooks"
Compare and export in the app#
Compare tests without code#
A comparison workbook computes statistics, such as each run’s maximum, across many runs or assets, and shows them in a table, scatter plot, or time series.
In the sidebar, click Workbooks, then the arrow beside NEW WORKBOOK, and choose New comparison workbook.
Click NEW PANEL and choose Comparison table, Comparison scatter plot, or Comparison time series.
In the new panel, click CREATE AGGREGATE QUERY.
Under Apply to, select the runs to compare. To compare assets instead, click RUNS, choose Select assets, then select the assets and a time frame.
Under Filter by ranges, choose the part of each run to compare, for example where a channel is above a threshold.
Add the channels to compare. In a Comparison table, add each one under Channels for statistical comparison and choose its statistic.
In the Unsaved changes bar, click Apply changes.
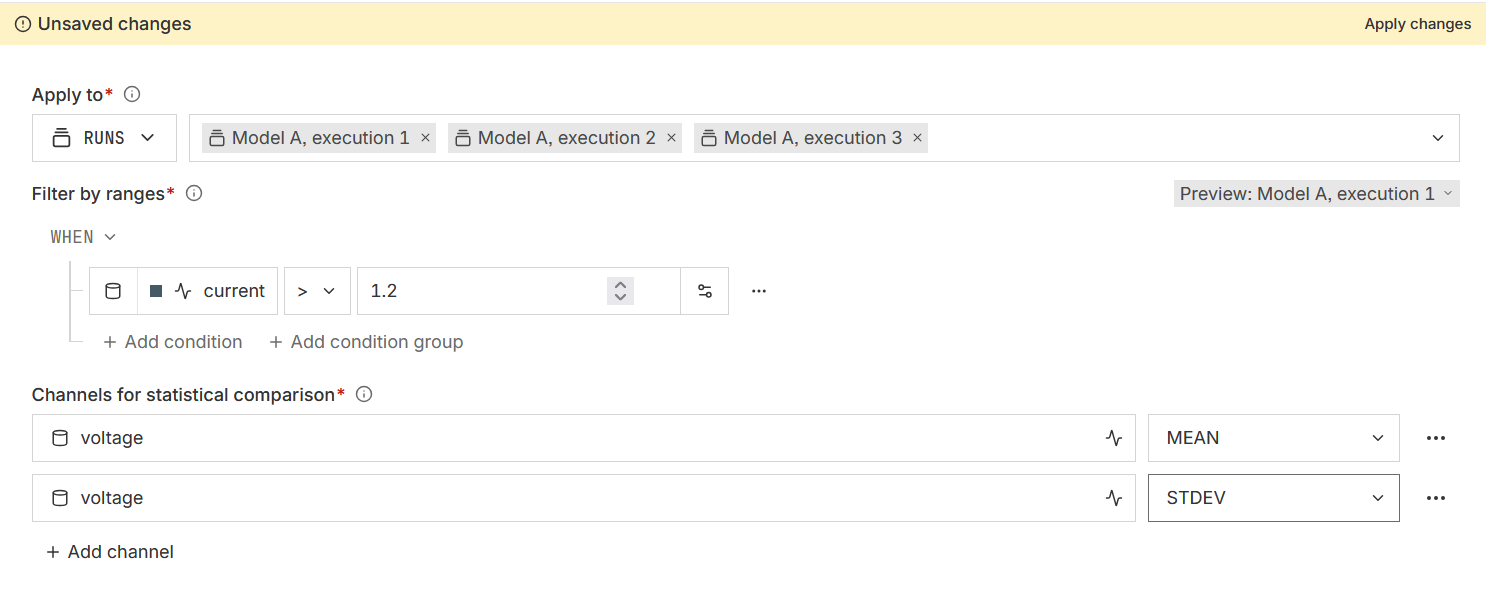
A comparison table then shows one row for each run, with the part of the run the filter matched and each statistic, and a last row that summarizes the runs, such as their MEAN.

A Comparison time series panel lines each run up at the start of its Filter by ranges range on its own.
For the statistics a comparison can compute, aggregation windows, and a walkthrough video, see 🔒︎Comparison workbooks.
Export to a file#
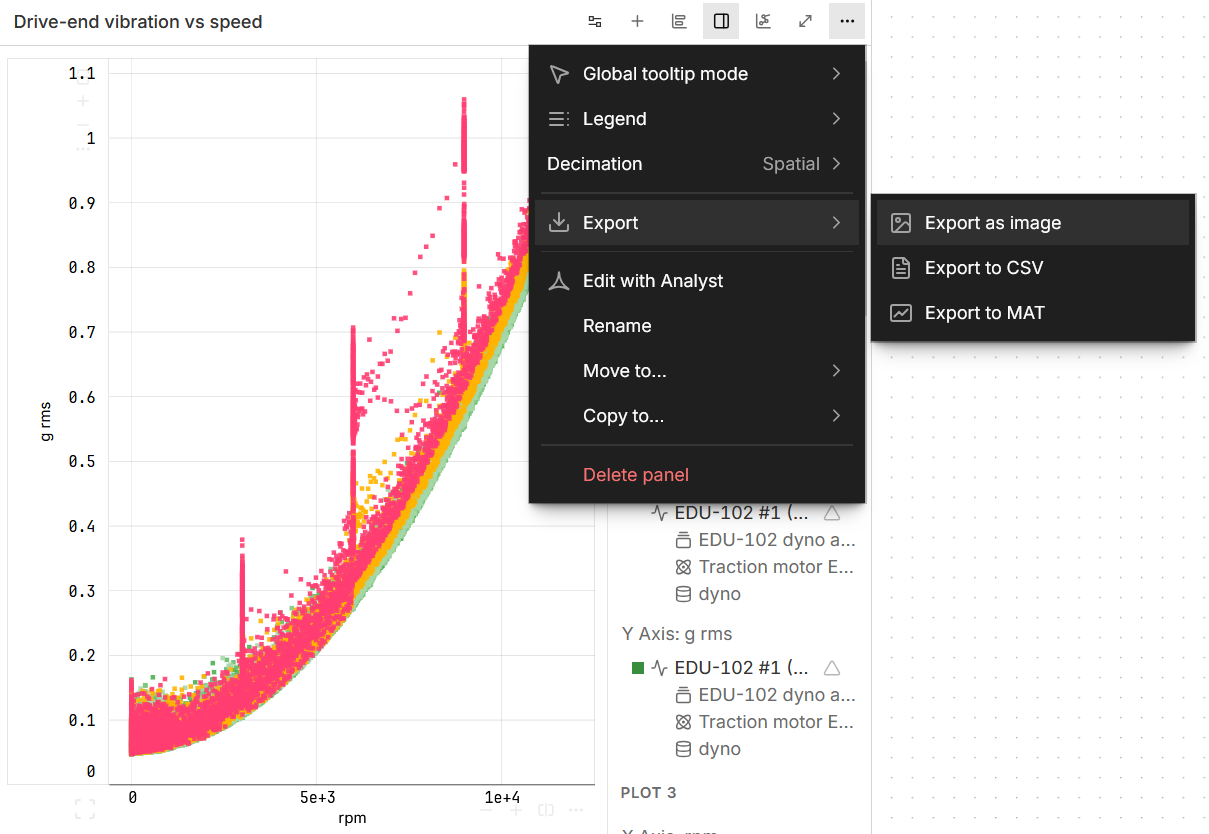
In a workbook, open a chart’s ⋯ menu, then Export, and choose Export to CSV or Export to MAT.
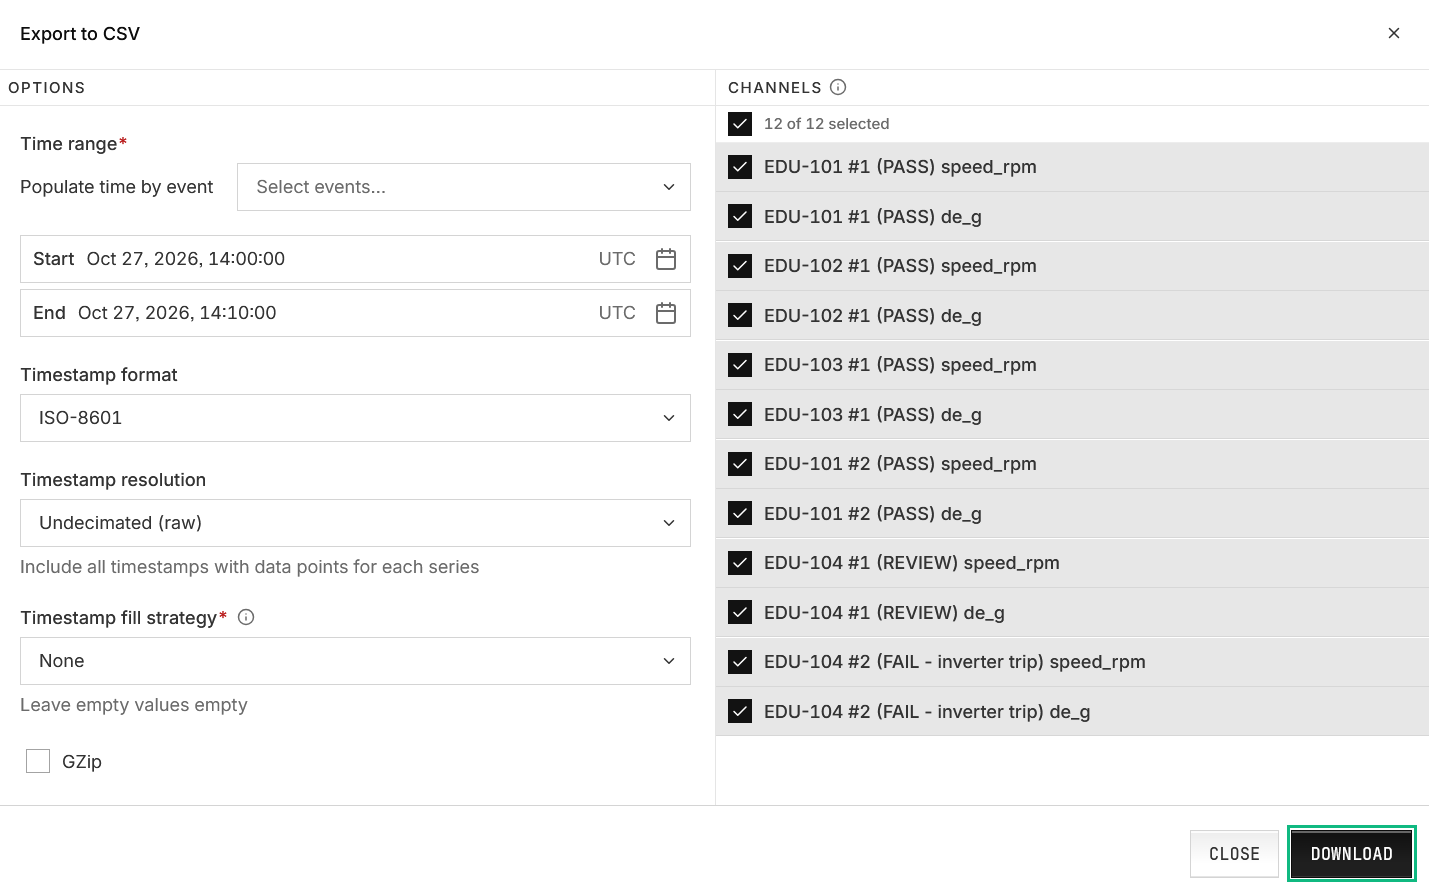
Set the Time range, the Timestamp format, and the Timestamp resolution (raw, or resampled to a frequency or period).
Pick the channels, then click DOWNLOAD.
To export from one of an asset’s data sources instead, open the asset’s Data sources tab, click the Export data icon on that row, and choose Export as CSV or Export as MAT.
Line up tests on one timeline#
Tests recorded at different times sit apart on a workbook’s timeline. To display them side by side in a standard workbook, rather than a comparison workbook, shift them in time. A time offset shifts a run’s data in that workbook only, without changing what’s stored.
There are two ways to line up runs in a workbook:
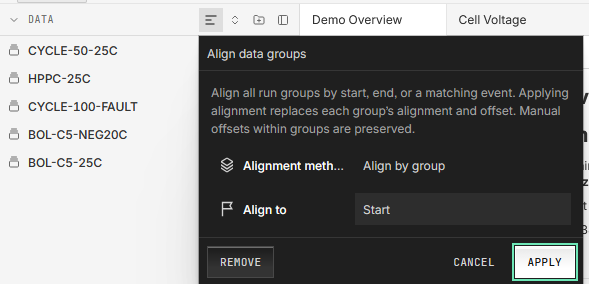
Align every run at once: line up all the workbook’s runs by their start or end. Start here for managing runs in bulk.
Align one run to another: aligns a pair of runs by their start or end, or by a fixed time offset.
Prerequisite: Adding runs to the panel#
To line up tests in a workbook, they must all be available in the workbook’s DATA panel. To add runs:
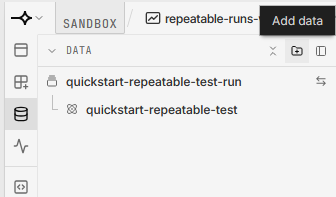
In the workbook’s left sidebar, click the Data icon to open the DATA panel.
Click Add data at the top of the panel. If a menu opens, choose New group, so each run stays separate. Select the runs in Select runs, and click ADD RUN TO THIS WORKBOOK. With several runs selected, the button counts them, such as ADD 3 RUNS TO THIS WORKBOOK.
Align every run at once#
Once the workbook has two or more runs, click Align data groups in the DATA panel’s header, choose Align by group, set Align to to Start or End, and click APPLY.
Align one run to another#
In the DATA panel, hover over the run to move and click its Add time offset icon.
Under Shift method, choose Align to run. Pick the Alignment run, and under Align to choose Start or End.
Click ADD TIME OFFSET.
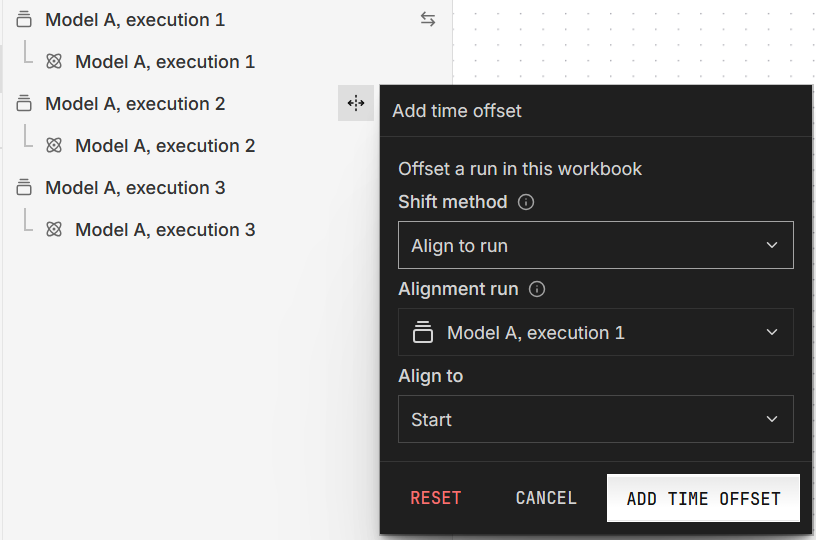
Align runs to a run that has no offset of its own, because Align to run uses the reference run’s recorded start or end, not its shifted position.
Shift by a fixed amount#
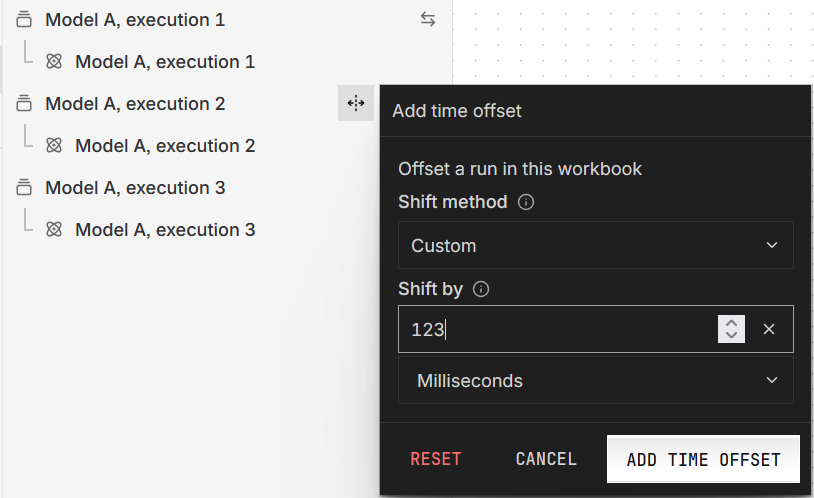
To shift by a fixed amount instead, such as a known clock difference between two loggers, follow Align one run to another, but choose Custom under Shift method and enter Shift by and its unit.
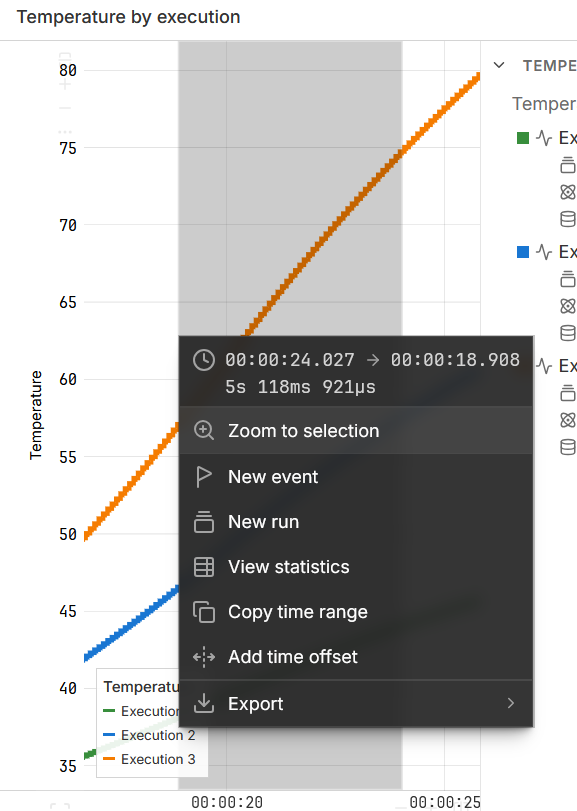
To measure a fixed shift on a chart instead, drag across a time series from a feature to where it should land, choose Add time offset, pick the run, asset, or data scope under Add offset to, and click APPLY. Offsets on a data scope, asset, and run add up, so adjust complex offsets in that order.
Work in code#
Pull data into your code#
If the asset filters a shared dataset by tag, as in the tagged approach, pass the same tags when you pull its data, with tags={...} in Python or Tags=struct(...) in MATLAB.
Get the run’s dataset by its ref name. datasource_to_dataframe returns a pandas DataFrame with one column per channel and a UTC timestamp index:
from nominal.core import NominalClient
from nominal.thirdparty.pandas import datasource_to_dataframe

client = NominalClient.from_profile("default")
run = client.get_run("<ri.scout.instance.run.identifier>")
dataset = run.get_dataset("default")  # the run's data, by ref name

df = datasource_to_dataframe(
    dataset,
    start=run.start,
    end=run.end,
)
For several tests, search for their runs and pull each one:
runs = client.search_runs(labels=["acceptance"])
frames = {
    r.name: datasource_to_dataframe(r.get_dataset("default"), channel_exact_match=["temperature"], start=r.start, end=r.end)
    for r in runs
}
fetch returns a timetable for one channel. A run’s data sources are its asset’s:
client = nominal.Client.fromProfile();
r = client.runByRid("<ri.scout.instance.run.identifier>");
asset = client.assetByRid(r.AssetRids(1));
sources = asset.datasources();
dataset = client.datasetByRid(sources.Rid(sources.RefName == "default"));

temperature = dataset.fetch("temperature", r.StartTime, r.EndTime);
current = dataset.fetch("current", r.StartTime, r.EndTime);
tt = synchronize(temperature, current);  % one timetable with both channels
Note
This code relies on runs being completed because it uses the run’s end time.
Write results back#
Before calculating in code, check whether a workbook can do it. Transforms cover calculations such as unit conversions and rates of change, and formulas combine channels, as in How does analysis work in Nominal?. Their results stay in the workbook, with nothing to upload.
Put calculated channels in a dataset of their own and attach it to the asset under its own ref name, like derived. A workbook can then refer to both the original and processed data. If the run’s asset was generated automatically, as it is for a run created directly from a dataset, attach the results to the run instead.
from nominal.thirdparty.pandas import upload_dataframe_to_dataset

out = df[["temperature"]].rolling(50).mean().add_suffix("_avg").dropna()
out.index = out.index.as_unit("ns").asi8  # nanoseconds since the epoch
out.index.name = "timestamp"

asset = run.list_assets()[0]
try:
    derived = asset.get_dataset("derived")  # one results dataset per asset
except ValueError:
    derived = client.create_dataset(f"{asset.name} derived")
    asset.add_dataset("derived", derived)
upload_dataframe_to_dataset(derived, out, timestamp_column="timestamp", timestamp_type="epoch_nanoseconds")
upload_dataframe_to_dataset waits until the upload has been ingested.
avg = movmean(temperature.temperature, [49 0]);  % trailing 50-sample mean

derived = asset.getOrCreateDataset(asset.Name + " derived", "derived");  % one results dataset per asset
derived.write("temperature_avg", temperature.Time, avg);
write returns once the data is accepted, before it’s ingested, and suits up to about 50,000 points per call. For more, stream them with derived.stream().
Query with SQL#
To filter or aggregate before the data leaves Nominal, query it with SQL. In the app, open SQL under Data in the sidebar. From code, call the SQL REST API, as in Executing SQL.
Organize data after the fact#
Data that’s already recorded can still be organized by marking each test’s time range on its asset as a run. Comparing, exporting, lining up, and pulling data, as above, then work on it like any other run.
Mark a past test as a run#
Open the asset and find the test on the timeline above its tabs, using the period menu (such as WEEK), Fit to today (the calendar icon), or the arrows.
Drag across the timeline over the test and choose New run from time bounds. The run’s asset, Start, and End are filled in.

Enter a title, and optionally add Labels and properties.
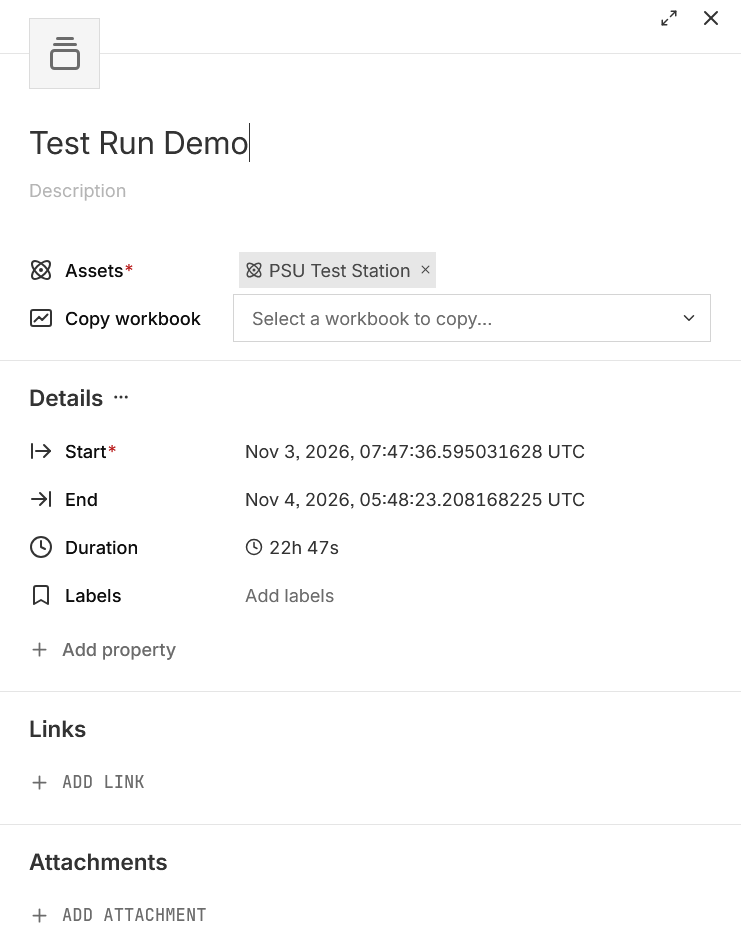
Click CREATE RUN.
You can also drag across a time series chart in a workbook and choose New run, or use New run from file time range in a file’s ⋯ menu on the asset’s Data sources tab. NEW RUN on the Runs page starts with nothing filled in.
from datetime import datetime, timezone
from nominal.core import NominalClient

client = NominalClient.from_profile("default")
asset = client.get_asset("<ri.scout.instance.asset.identifier>")
run = asset.create_run(
    "Acceptance test 12",
    start=datetime(2026, 1, 1, 14, 0, tzinfo=timezone.utc),
    end=datetime(2026, 1, 1, 14, 30, tzinfo=timezone.utc),
    labels=["acceptance"],
)
client = nominal.Client.fromProfile();
asset = client.assetByRid("<ri.scout.instance.asset.identifier>");
t0 = datetime("2026-01-01 14:00:00", TimeZone="UTC");
t1 = datetime("2026-01-01 14:30:00", TimeZone="UTC");

r = asset.run("Acceptance test 12", t0).finish(t1);
r = r.update(Labels=["acceptance"]);
Group runs with labels and properties#
Open the run or asset. In its properties panel, click Labels (Add labels when there are none) and pick or create a label.
To add a property, click Add property, pick or create a key, then set its value.
Changes save as you make them. To label several runs or assets at once, select them on the Runs or Assets page and click EDIT LABELS.
from nominal.core import NominalClient

client = NominalClient.from_profile("default")
run = client.get_run("<ri.scout.instance.run.identifier>")  # or client.get_asset(...); assets work the same way

# update replaces labels and properties, so keep the existing ones
run.update(labels=[*run.labels, "acceptance"], properties={**run.properties, "campaign": "Q4"})
client = nominal.Client.fromProfile();
r = client.runByRid("<ri.scout.instance.run.identifier>");  % or client.assetByRid(...)

r = r.update(Labels=[r.Labels "acceptance"]);  % Labels replaces the run's labels
Setting Properties replaces all of the run’s properties, so this example only adds a label.
use nominal::core::RunUpdate;

let client = nominal::NominalClient::from_profile("default")?;
let rid = "<ri.scout.instance.run.identifier>";
let run = client.runs().get(rid).await?;

// update replaces labels and properties, so keep the existing ones
let mut labels = run.labels().to_vec();
labels.push("acceptance".into());
let mut properties = run.properties().clone();
properties.insert("campaign".into(), "Q4".into());
client.runs().update(rid, RunUpdate::new().labels(labels).properties(properties)).await?;
// assets work the same way, with client.assets() and AssetUpdate
This Go example updates an asset:
import (
	nominalapi "github.com/nominal-io/nominal-api-go/io/nominal/api"
	assetapi "github.com/nominal-io/nominal-api-go/scout/asset/api"
	"github.com/nominal-io/nominal-api-go/scout/assets"
	scoutrids "github.com/nominal-io/nominal-api-go/scout/rids/api"
	"github.com/palantir/pkg/rid"
)

// httpClient is a conjure-go-runtime httpclient.Client for your Nominal REST API URL,
// and token is your API key as a bearertoken.Token
assetClient := assets.NewAssetServiceClient(httpClient)
parsed, _ := rid.ParseRID("<ri.scout.instance.asset.identifier>")
assetRid := scoutrids.AssetRid(parsed)
found, _ := assetClient.GetAssets(ctx, token, []scoutrids.AssetRid{assetRid})
asset := found[assetRid]

// the update replaces labels and properties, so keep the existing ones
labels := append(asset.Labels, "acceptance")
properties := map[nominalapi.PropertyName]nominalapi.PropertyValue{"campaign": "Q4"}
for k, v := range asset.Properties {
	if _, set := properties[k]; !set {
		properties[k] = v
	}
}
assetClient.UpdateAsset(ctx, token, assetRid, assetapi.UpdateAssetRequest{Labels: &labels, Properties: &properties})
To find the runs together later:
In the sidebar, click Runs, then FILTERS.
Choose Label and pick the labels, or choose a property’s key and pick its value. With more than one filter, click MATCH ALL FILTERS to switch it to MATCH ANY FILTER.
To keep the search, click NEW VIEW. Right-click the view’s tab to rename it.
from nominal.core import NominalClient

client = NominalClient.from_profile("default")

# a run must have every label and property listed
runs = client.search_runs(labels=["acceptance"], properties={"campaign": "Q4"})
for run in runs:
    print(run.name, run.rid)
use nominal::core::RunQuery;

let client = nominal::NominalClient::from_profile("default")?;

// a run must match every query listed
let runs = client.runs()
    .search(RunQuery::and([RunQuery::label("acceptance"), RunQuery::property("campaign", "Q4")]))
    .await?;
for run in &runs {
    println!("{} {}", run.name(), run.rid());
}
Attach additional data#
If some of a test’s data was recorded into a dataset that isn’t already attached to the asset, you can add it under its own ref name:
Open the asset. If its properties panel is hidden, open it with the panel icon at the top right, beside NEW WORKBOOK. Find the Data source section.
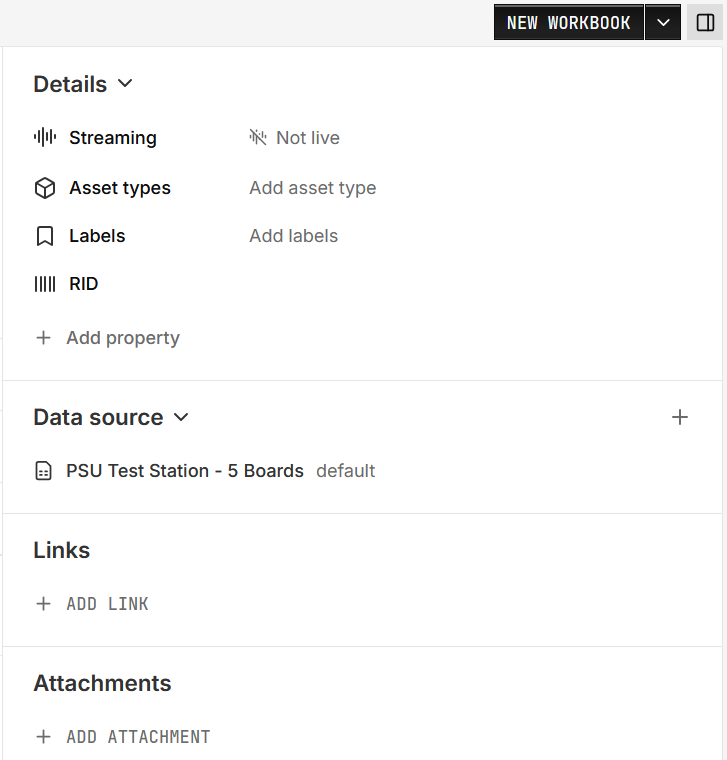
Click + (Add data source) and pick the dataset. If the asset has no data sources yet, click ADD DATA SOURCE instead.
Under Refname, choose or create a ref name.
To attach only part of a shared dataset, click ADD TAG FILTERS, choose the tag key, then click its value and pick the value.
Click SAVE TO ASSET.
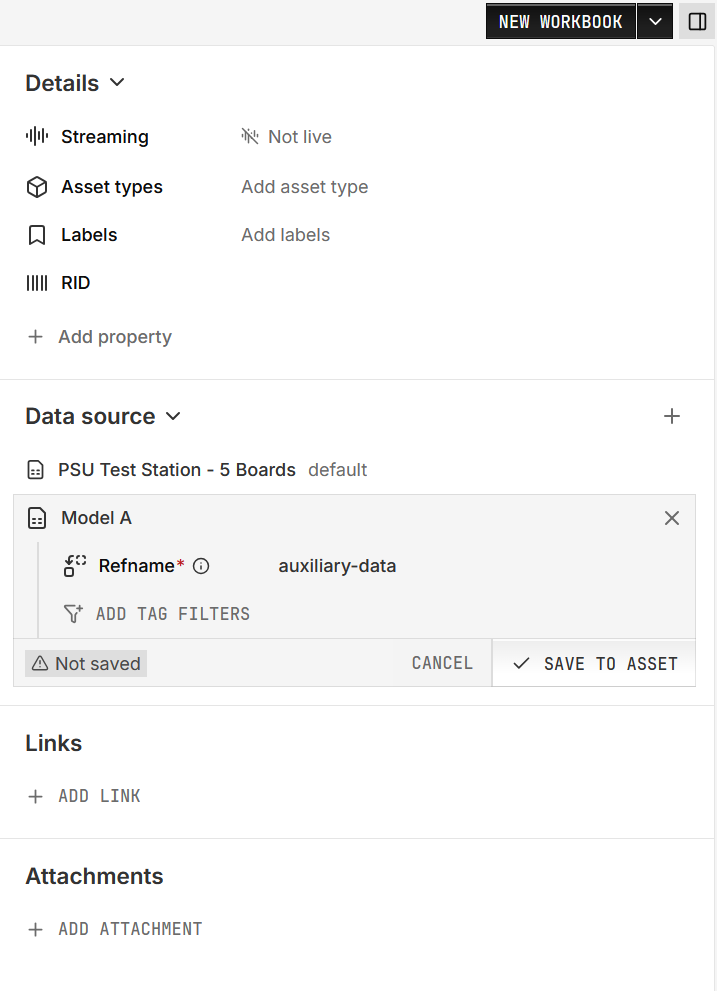
Every run on the asset now includes the dataset under that ref name.
dataset = client.get_dataset("<ri.catalog.instance.dataset.identifier>")
asset.add_dataset("logger_b", dataset)
dataset = client.datasetByRid("<ri.catalog.instance.dataset.identifier>");
asset.addDataset(dataset, "logger_b");
Next steps#
Exporting data and Exporting data by SQL: the same tasks in other languages.
Repeatable test execution: how tests become runs in the first place.
The SQL guides: the tables, scoping rules, and query patterns.