

Controller development#
Story: “We’re developing a controller, starting with a handful of dev boards. I probe some signals by hand and script the rest, rework boards as bugs turn up, and want each board’s data live now and comparable later.”
This page is for engineers developing a controller or other board on a small run of development boards, between first bench experiments and production testing.
How to organize your data#
Use the default approach. Tracking every board separately takes discipline, but once boards are reworked, configuration management and bug traceability depend on it. Give each board an asset and a dataset of its own, linked under the same ref name for every board, such as default. Every measurement, run, and change then stays with the board it belongs to, and one workbook or checklist works on all of them.
Every measurement recorded about a board goes into that board’s dataset, whether you probed it by hand, a script read it, or another tool exported it. As development progresses, automate more of those tests, and check the results with automated checks. Record fixed facts about the board, such as its revision, in the asset’s properties.
        ---
config:
  layout: elk

---
flowchart BT
    classDef purple fill:#e0e7ff,stroke:#4338ca,color:#1f2937
    classDef blue fill:#e0f2fe,stroke:#0369a1,color:#1f2937
    classDef green fill:#dcfce7,stroke:#15803d,color:#1f2937
    classDef red fill:#fee2e2,stroke:#b91c1c,color:#1f2937

    dataset3[("Dataset<br>Dev board 3<br><br>dmm.dc_voltage<br>scope.ch1.duty_cycle<br>...")]:::purple
    asset3["Asset: Dev board 3<br><br>Properties:<br>revision=A"]:::green
    dataset3 -->|"ref name=default"| asset3
    run3["Run: Bring-up<br><br>Properties:<br>firmware=0.3.1"]:::red
    asset3 --> run3
    workbook3["Live workbook<br>Dev board 3"]:::blue
    asset3 --> workbook3

    dataset4[("Dataset<br>Dev board 4")]:::purple
    asset4["Asset: Dev board 4<br><br>Properties:<br>revision=A"]:::green
    dataset4 -->|"ref name=default"| asset4

    click asset3,asset4 href "../../../#asset" "Asset"
    click dataset3,dataset4 href "../../../#time-series-data" "Time-series data"
    click run3 href "../../../#runs" "Runs"
    click workbook3 href "../../../../workbooks/#live-workbooks" "Live workbooks"
Mark test sessions with runs, as in Record each test session as a run. Runs also support properties and other metadata, so you can store key parameters such as the firmware build under test. Comparing runs also shows how each board has performed over time, before and after each fix.
A significant change to a board, such as a rework, can be recorded as an event, as a run, or as a new asset for the reworked board.
If a shared instrument records data for several boards and tags it with the board under test, see Combining the default and tagged approaches.
When the design moves on to testing many units on one test station, organize that data as in Test station development.
Walkthrough#
Whatever drives your instruments, the workflow is the same. Each board’s measurements go to its own dataset, tagged with where they were taken, and each test session becomes a run. The examples use instro, which provides the instrument drivers and streams every reading and command to Nominal. To send the same data from your own scripts or tools, tag it as you upload or stream it.
Set up each board#
Give each board an asset with a dataset of its own, under the same ref name:
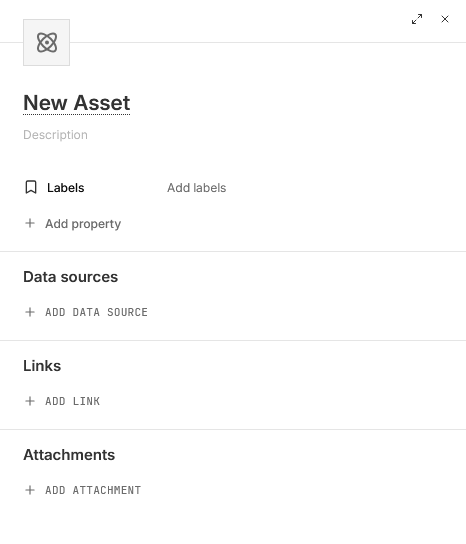
In the sidebar, click Assets, then NEW ASSET.
Give the asset a title, and add Labels and properties (Add property) that describe the unit.
Under Data sources, click ADD DATA SOURCE, then New dataset, or pick an existing dataset.
Under Refname, type
default, the same on every unit, and click Create “default”.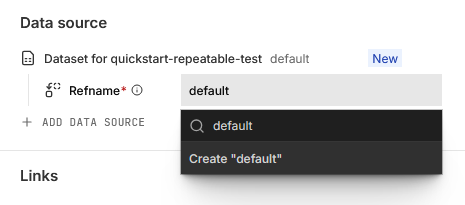
Click CREATE ASSET and then View asset in the notification.
Record each test session as a run#
Start a run on the board’s asset when a test session begins:
On the asset’s page, click the arrow beside NEW WORKBOOK in the top right and choose New run. You can also create a run by selecting the Runs tab and pressing NEW RUN.
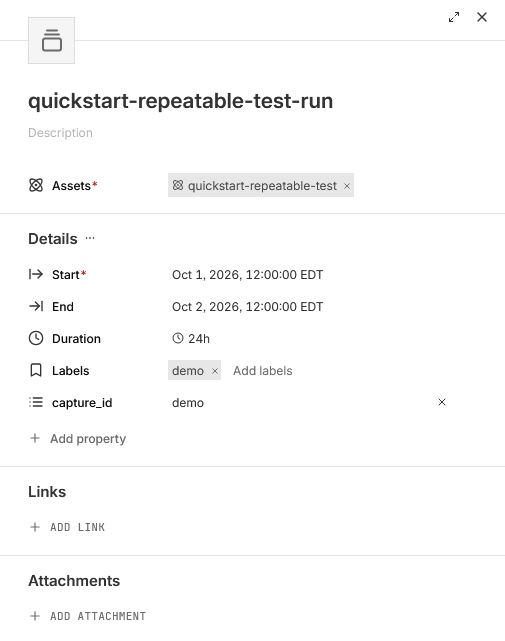
Give the run a title, and set its Start to when the test began. Leave End empty while the test is running. If the test is already over, set End too, or, if the asset’s files cover the test, click Add files under Determine bounds with files and pick the files to set both from them.
Add labels and properties for the test, such as the procedure or its revision, and click CREATE RUN.
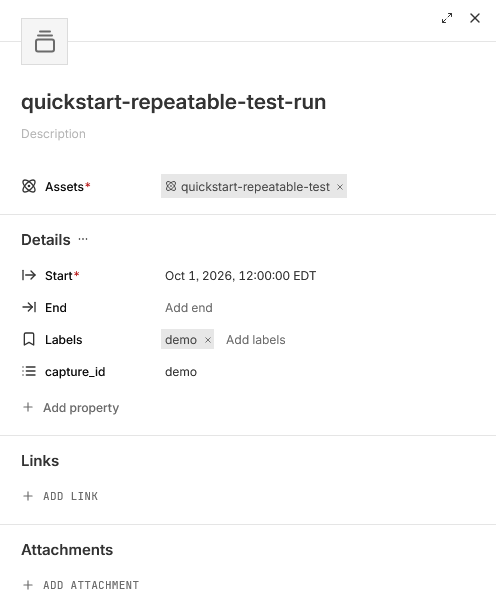
If you left End empty, set it under Details on the run’s page once the test is over and its data is in.
Probe a board#
In the example below, you move a meter’s probes between test points by hand, and the script records each reading in the board’s dataset, tagged with its test point.
from instro.dmm import InstroDMM
from instro.dmm.drivers import VirtualDMM

dmm = InstroDMM(
    name="dmm",
    driver=VirtualDMM(),  # a simulated meter; swap in your meter's driver
    dataset_rid="<ri.catalog.instance.dataset.identifier>",  # the board's dataset
)

with dmm:
    for test_point in ["TP1", "TP2", "TP3"]:
        input(f"Probe {test_point}, then press Enter")
        reading = dmm.read_dc_voltage(test_point=test_point)  # keyword arguments tag this reading
        print(test_point, reading.latest)
instro names the channel after the instrument, not the point probed, so every reading goes to dmm.dc_voltage, and its test_point tag tells the test points apart. This mixes in the tagged approach, so some data may be represented as distinct channels while other data must be split by tag.
In a workbook, plot each test point as its own series by splitting the variable that plots dmm.dc_voltage by test_point:
In the left sidebar’s Channels & variables view, find the VARIABLES section, hover over the variable, and click its Transform icon.
In the Transform window, click the settings icon on the Series row.
In the Series window, choose the tag under Split by tags, and click APPLY.
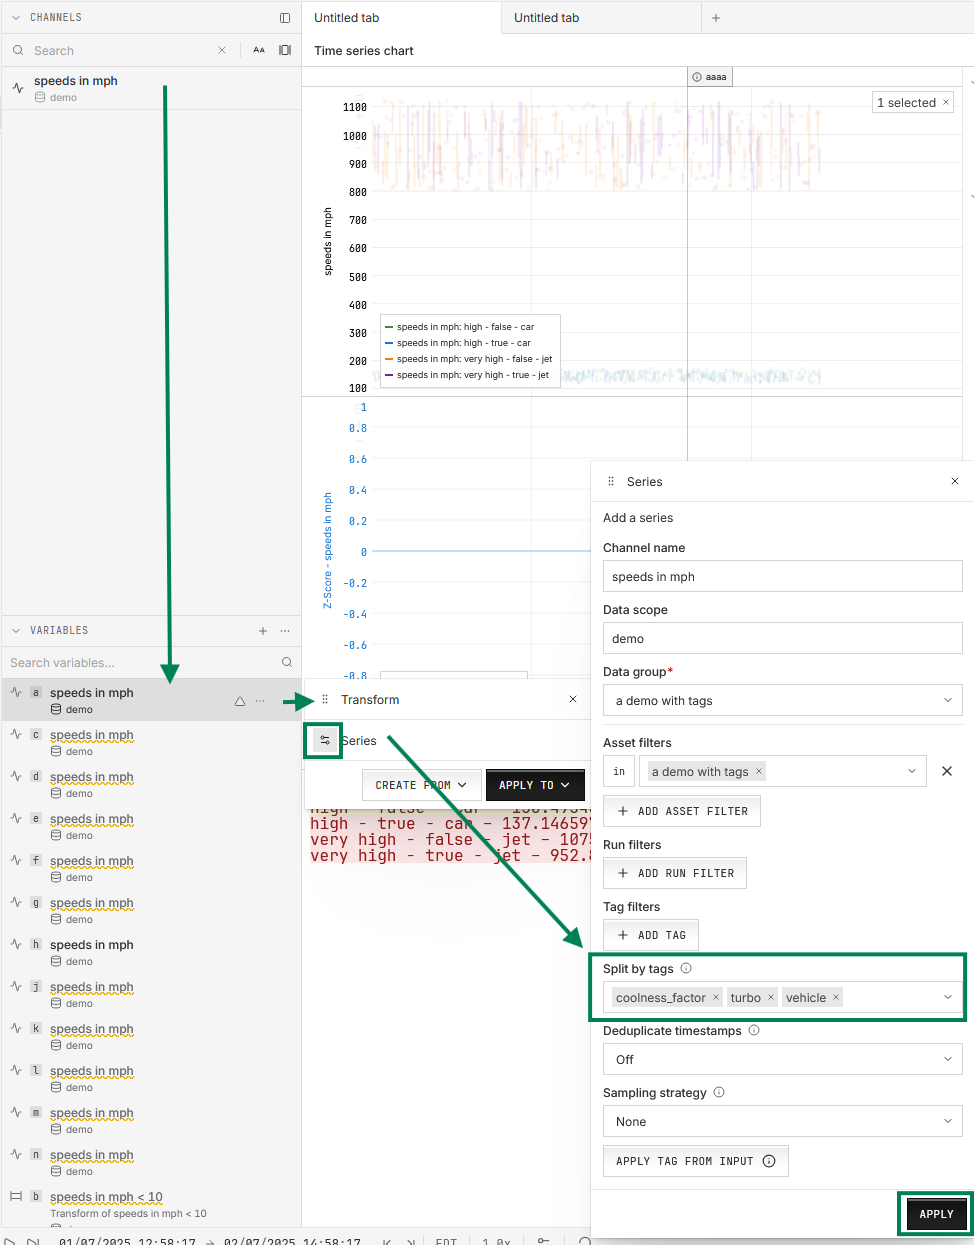
instro supports sending commands, such as sweeping a power supply through its output range, and writes each setpoint to a channel ending in .cmd next to the readings. For a tool instro doesn’t drive, such as a logic analyzer, export its capture to CSV and upload it to the same board’s dataset.
Poll at a fixed interval#
instro can poll an instrument in the background at a set interval. This permits continuous monitoring of a board during a test without user interaction:
import time

from instro.dmm import InstroDMM, MeasurementFunction
from instro.dmm.drivers import VirtualDMM

dmm = InstroDMM(
    name="dmm",
    driver=VirtualDMM(),  # a simulated meter; swap in your meter's driver
    dataset_rid="<ri.catalog.instance.dataset.identifier>",  # the board's dataset
)
dmm.background_interval = 0.1  # poll every 100 ms

with dmm:
    dmm.set_measurement_function(MeasurementFunction.DC_VOLTAGE)
    dmm.start()  # poll in the background until the block ends
    time.sleep(60)  # the board runs while the meter records its output
The background polling is best effort. instro records its own timing as dmm.loop_time and dmm.daemon_work_time for diagnostic purposes, and measured data is timestamped on read.
Watch it live#
Open the board’s asset, click NEW WORKBOOK, and drag the channels you want onto the canvas. To follow the data as it arrives:
In the bottom bar, click GO LIVE. The button reads LIVE while the workbook streams. Click it again to stop.
Choose a time window from the dropdown beside it. The default is the last 30 seconds.
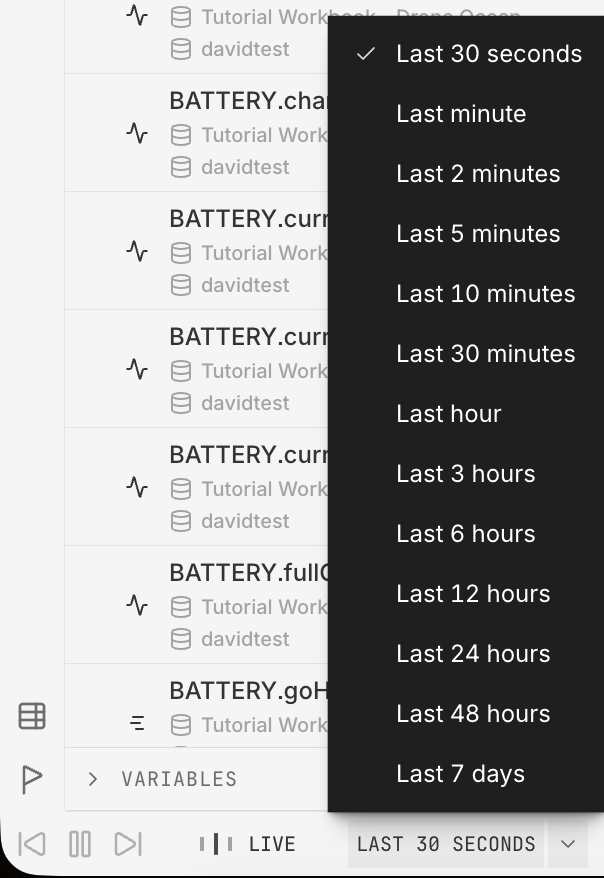
GO LIVE isn’t available if the workbook has time offsets, if all of its runs have ended, or if its data source can’t stream, such as an external database connection.
Live monitoring during a test covers building a workbook layout once and opening it for each board.
Next steps#
Live monitoring during a test: live layouts, calculations, and missing channels.
Repeatable test execution: runs, templates, and comparing runs.
Test station development: one station, with the units swapped through it told apart by tag.
Combining the default and tagged approaches: each board’s own dataset alongside a shared source tagged by board.
instro: instruments, simulators, and publishers.