

Complex and nested assets#
This approach is for units under test built from components that are tested on their own and can move from one unit to another.
For example, a vehicle is a system, and each of its swappable battery modules is a component. The system’s controller records the system’s own data, and each component records its own. Between tests, a component can be swapped into another system. You want each system’s data, with whichever components it carried, and each component’s history across every system it has been in.
        ---
config:
  layout: elk

---
flowchart LR
    classDef part fill:#f5f5f4,stroke:#57534e,color:#1f2937

    subgraph s1["System S1"]
        m1["Component C1"]:::part
        s1m2["Component C2"]:::part
    end
    style s1 fill:#fffbeb,stroke:#b45309,color:#1f2937

    subgraph s2["System S2"]
        m3["Component C3"]:::part
        s2m2["Component C2"]:::part
    end
    style s2 fill:#fffbeb,stroke:#b45309,color:#1f2937

    s1m2 -.->|"swapped in between tests"| s2m2
Implementing this approach#
Tag every data point with the system and component it belongs to when it’s recorded or uploaded.
        ---
config:
  layout: elk

---
flowchart LR
    classDef part fill:#f5f5f4,stroke:#57534e,color:#1f2937
    classDef system fill:#fffbeb,stroke:#b45309,color:#1f2937
    classDef green fill:#dcfce7,stroke:#15803d,color:#1f2937

    %% declared top to bottom, so each row is an entity and its asset
    system["System S1"]:::system
    subgraph installed["Installed in system S1"]
        m1["Component C1"]:::part
        m2["Component C2"]:::part
    end
    style installed fill:#fffbeb,stroke:#b45309,color:#1f2937

    systemAsset["Asset: System S1"]:::green
    m1Asset["Asset: Component C1"]:::green
    m2Asset["Asset: Component C2"]:::green

    system --> systemAsset
    m1 --> m1Asset
    m2 --> m2Asset

    click systemAsset,m1Asset,m2Asset href "../../#asset" "Asset"
The system’s own data is tagged with its identifier, such as system=S1. Each component that produces data tags it with both its own identifier and its system’s, such as component=C1 and system=S1. Systems share one dataset, and components share another.
Give each system and each component a metadata asset of its own, which filters its type’s dataset on its identifier, such as component=C1. A system’s asset links the systems dataset under a standard ref name, such as default, and the components dataset under another, such as components, both filtered on the system’s identifier (system=S1).
        ---
config:
  layout: elk

---
flowchart BT
    classDef green fill:#dcfce7,stroke:#15803d,color:#1f2937
    classDef purple fill:#e0e7ff,stroke:#4338ca,color:#1f2937

    subgraph systemData["Dataset: Systems"]
        s1points["system=S1<br>09:00:00 · 12.1<br>..."]:::purple
    end
    style systemData fill:#f5f7ff,stroke:#4338ca,color:#1f2937

    subgraph moduleData["Dataset: Components"]
        m1points["component=C1, system=S1<br>09:00:00 · 41.5<br>..."]:::purple
        m2points["component=C2, system=S1<br>09:00:00 · 40.9<br>..."]:::purple
        m3points["component=C3, system=S2<br>09:00:00 · 42.2<br>..."]:::purple
    end
    style moduleData fill:#f5f7ff,stroke:#4338ca,color:#1f2937

    s1["Asset: System S1"]:::green
    systemData -->|"ref name=default<br>filter system=S1"| s1
    moduleData -->|"ref name=components<br>filter system=S1"| s1

    am1["Asset: Component C1"]:::green
    am2["Asset: Component C2"]:::green
    am3["Asset: Component C3"]:::green
    moduleData -->|"ref name=default<br>filter component=C1"| am1
    moduleData -->|"ref name=default<br>filter component=C2"| am2
    moduleData -->|"ref name=default<br>filter component=C3"| am3

    click s1,am1,am2,am3 href "../../#asset" "Asset"
    click systemData,moduleData,s1points,m1points,m2points,m3points href "../../#time-series-data" "Time-series data"
In this design components have a record of data acquired regardless of system, and systems have a record of their data regardless of component, even when components move.
Telling the components apart#
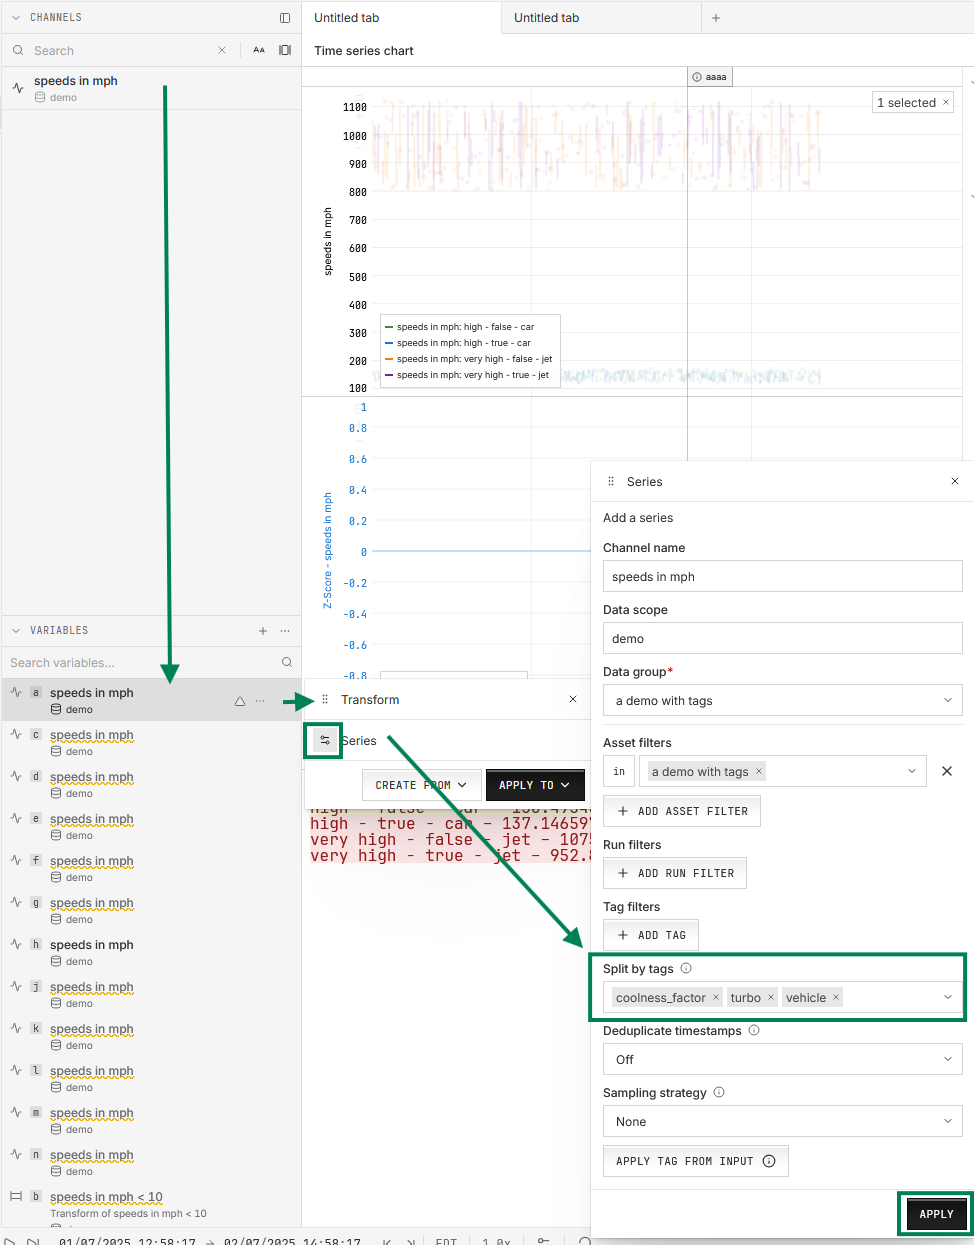
On a system’s asset, every component’s points share their channel names under the components ref name, so components.temperature holds the temperature of every component in the system. To see each component on its own, split the variable by the component tag:
In the left sidebar’s Channels & variables view, find the VARIABLES section, hover over the variable, and click its Transform icon.
In the Transform window, click the settings icon on the Series row.
In the Series window, choose the tag under Split by tags, and click APPLY.
In the app#
Tag each component’s data with both the component and the system as you upload it:
In the upload wizard’s Settings panel:
To give every row the same tag, under Tags click ADD TAG, choose or create the tag key, then click its value and choose or create the value.
To take each row’s tag from a column of the file, under Tag columns click ADD TAG COLUMN and pick the column. The column’s name becomes the tag key, and you can rename it. Tag columns work for CSV and Parquet files.
Streamed points get their tags from the code that streams them.
Then give each system and each component an asset:
In the sidebar, click Assets, then NEW ASSET.
Enter a title, such as
UUT1.Under Labels, pick or create a label, such as
prototype.Click Add property, create a property such as
serial_number, and enter its value, such asSN-001.Click CREATE ASSET.
And attach the datasets to each asset with its tag filter:
Open the asset. If its properties panel is hidden, open it with the panel icon at the top right, beside NEW WORKBOOK. Find the Data source section.
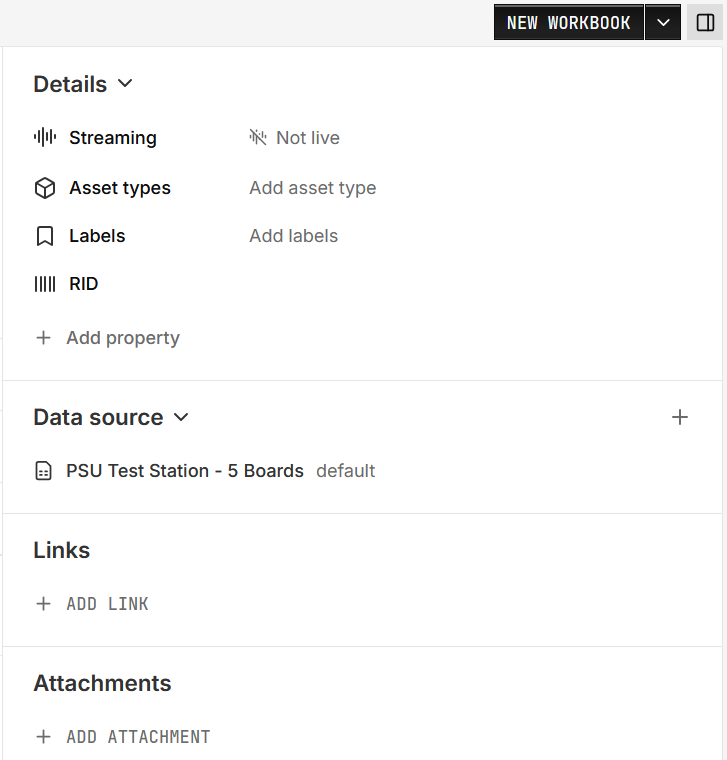
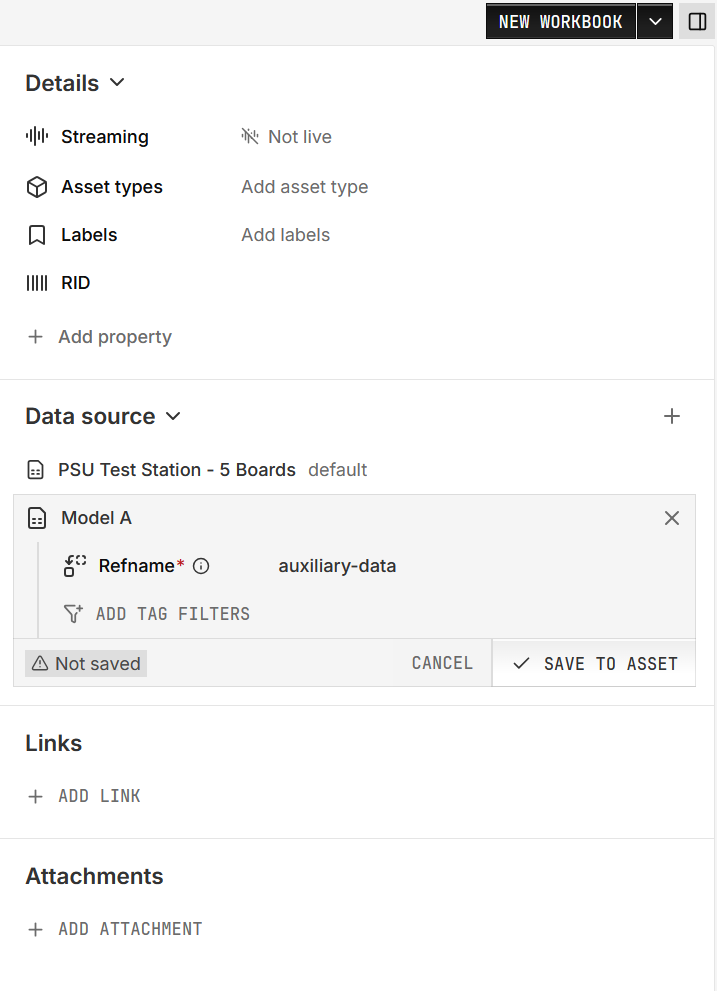
Click + (Add data source) and pick the dataset. If the asset has no data sources yet, click ADD DATA SOURCE instead.
Under Refname, choose or create a ref name.
To attach only part of a shared dataset, click ADD TAG FILTERS, choose the tag key, then click its value and pick the value.
Click SAVE TO ASSET.
In code#
In Python, give each system and component an asset with filtered links, then write a component’s points with both tags:
from nominal.core import NominalClient

client = NominalClient.from_profile("default")
systems = client.get_dataset("<ri.catalog.instance.dataset.identifier>")  # every system's own data
components = client.get_dataset("<ri.catalog.instance.dataset.identifier>")  # every component's data

system = client.create_asset("S1")
system.add_dataset("default", systems, series_tags={"system": "S1"})  # tag filter: this system's own data
system.add_dataset("components", components, series_tags={"system": "S1"})  # tag filter: the components while they're in S1

for component_id in ["C1", "C2", "C3"]:
    component = client.create_asset(component_id)
    component.add_dataset("default", components, series_tags={"component": component_id})  # tag filter: this component, in any system

# Each component point carries the component and the system it's in when it's recorded
with components.get_write_stream() as stream:
    stream.enqueue("temperature", "2026-01-01T12:00:00Z", 41.5, tags={"component": "C1", "system": "S1"})
In Rust, MATLAB, and Go, the tagged approach’s code sets up the same filtered link. Use the tag and ref name for each level in place of the tagged approach’s.
Extensions#
More levels#
The same pattern extends to more levels, such as a fleet, its vehicles, and their battery modules. Tag each point with every level above it, and filter each level’s assets on that level’s tag.