

Live monitoring during a test#
Story: “I sit on console during a test and watch live telemetry from the system in front of me. I want every channel on screen, and calculations that still work on units that record fewer channels.”
This page is for engineers who watch a test or an operation as it happens, such as an operator who wants a live view of every channel on the unit in front of them, or an analyst who adds calculations on top of that telemetry.
Live monitoring prerequisites#
Live monitoring works from a unit’s asset, because an operator watches a physical unit. Each unit you monitor needs an asset. If your units don’t have assets yet, start from Organize and view your data.
One workbook template works on every asset that uses the same ref name, such as default.
        ---
config:
  layout: elk

---
flowchart BT
    classDef green fill:#dcfce7,stroke:#15803d,color:#1f2937
    classDef blue fill:#e0f2fe,stroke:#0369a1,color:#1f2937

    asset1["Asset: UUT1"]:::green
    asset2["Asset: UUT2"]:::green

    template["Workbook template<br>Console layout<br><br>Looks for `default`.(channel)"]:::blue
    workbook1["Live workbook<br>UUT1"]:::blue
    workbook2["Live workbook<br>UUT2"]:::blue
    asset1 --> workbook1
    asset2 --> workbook2
    template -.->|"new workbook from template"| workbook1
    template -.->|"new workbook from template"| workbook2

    click asset1,asset2 href "../../../#asset" "Asset"
    click template href "../../../../../quickstart/quick/quick-template/" "Workbook templates"
    click workbook1,workbook2 href "../../../../workbooks/#live-workbooks" "Live workbooks"
Walkthrough: live monitoring#
Stream data to Nominal#
Stream or upload data from your test system into each asset’s dataset with a client library or connector. If the units share a dataset, tag each point with an identifier.
Build the workbook template for your console#
In the sidebar, click Assets and open one unit’s asset.
Click NEW WORKBOOK. A new workbook opens as a blank canvas.
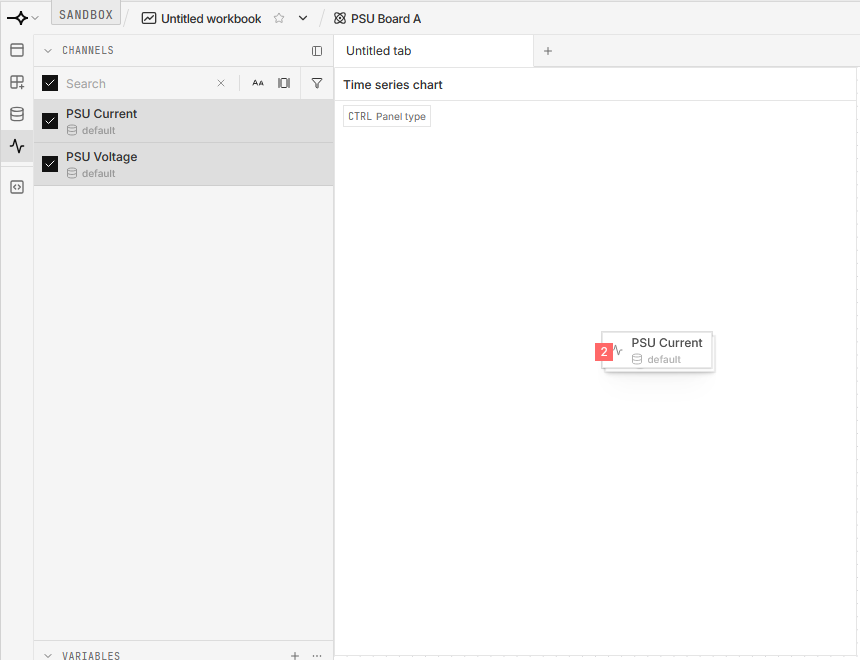
In the CHANNELS section of the Channels & variables sidebar, type to filter the channels. Select the ones you want with the checkboxes, or with Ctrl/Cmd-click and Shift-click.
Drag the selection onto the canvas to create a time series chart. Drag more channels onto an existing chart to plot them all together.
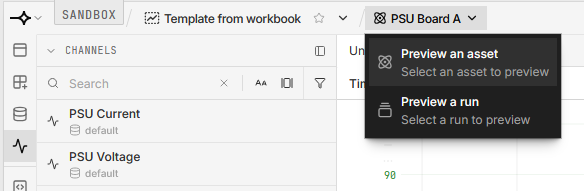
Save the layout as a template: open the workbook menu (the logo ▾ at the top left), then choose File ▸ New template. In the template editor, preview it against an asset, then click PUBLISH, enter a Message, and click PUBLISH.
Create a workbook instance for each unit under test#
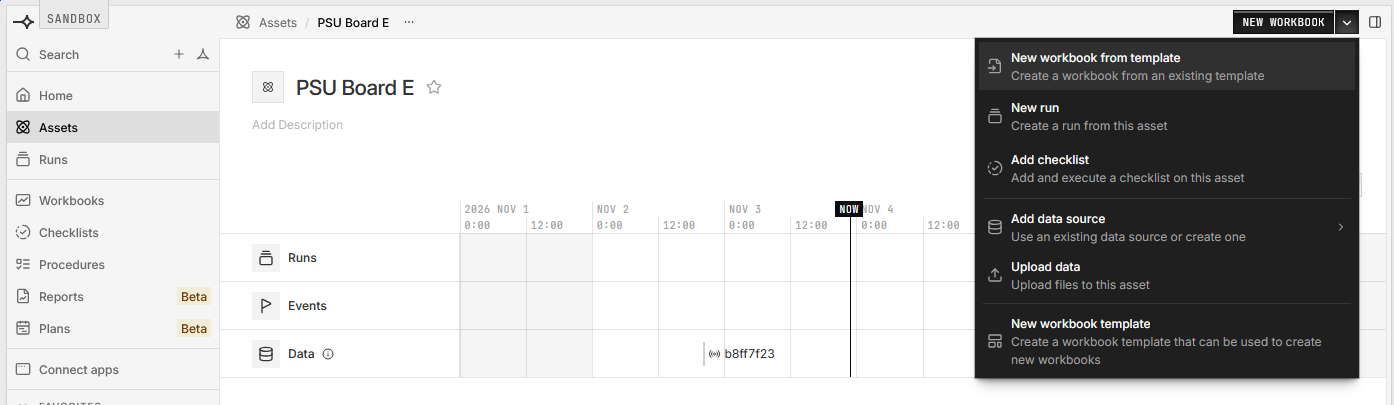
Open the unit’s asset.
Click the arrow beside NEW WORKBOOK and choose New workbook from template.
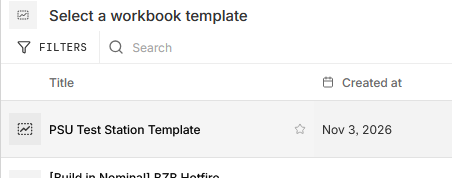
Pick your console template.
Go live#
In the bottom bar, click GO LIVE. The button reads LIVE while the workbook streams. Click it again to stop.
Choose a time window from the dropdown beside it. The default is the last 30 seconds.
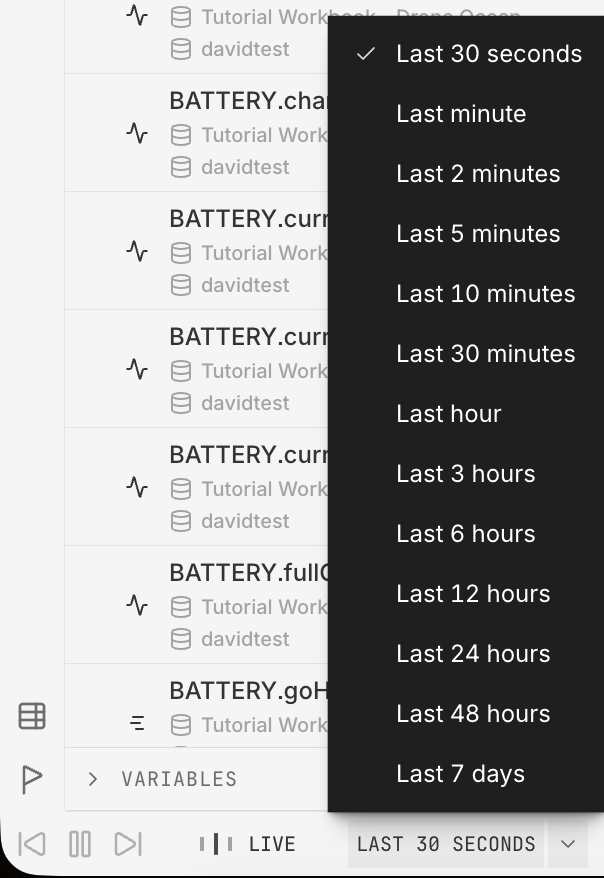
GO LIVE isn’t available if the workbook has time offsets, if all of its runs have ended, or if its data source can’t stream, such as an external database connection.
Once a test is complete, you can mark its time bounds with a run for later review.
Walkthrough: adding analysis#
How does analysis work in Nominal?#
A workbook doesn’t plot channels directly. Instead, data on a chart is a variable, which refers to a channel plus any transformation or manipulation of that channel’s raw data. Plotting a channel always creates a variable with no transformation.
Every variable has a variable name and a display name. The variable name, such as aa, ab, or ac, is the variable’s unique identifier in the workbook, and formulas use it. The display name defaults to the channel’s name and appears in charts and legends. Variables reference their channel by ref name and channel name, written default.voltage, rather than by dataset, so the same workbook and formulas work on every asset that uses that ref name.
        ---
config:
  layout: elk

---
flowchart RL
    classDef purple fill:#e0e7ff,stroke:#4338ca,color:#1f2937
    classDef blue fill:#e0f2fe,stroke:#0369a1,color:#1f2937

    subgraph dataset1["Dataset: UUT1"]
        voltage["Channel: voltage"]:::purple
        current["Channel: current"]:::purple
    end
    style dataset1 fill:#f5f7ff,stroke:#4338ca,color:#1f2937

    subgraph workbook1["Workbook"]
        aa["<u>Variable aa</u><br>Display name: voltage<br>Points to: default.voltage"]:::blue
        ab["<u>Variable ab</u><br>Display name: current<br>Points to: default.current"]:::blue
        ac["<u>Variable ac</u><br>Display name: power<br>Formula: aa * ab"]:::blue
        chart["Chart"]:::blue
    end
    style workbook1 fill:#f0f9ff,stroke:#0369a1,color:#1f2937

    aa --> voltage
    ab --> current
    ac --> aa
    ac --> ab
    chart --> aa
    chart --> ac

    click dataset1,voltage,current href "../../../#time-series-data" "Time-series data"
    click aa,ab,ac href "../../../../reference/glossary/#variable" "Variable"
The transformations permitted by a variable include filtering a channel by tags, splitting data by tag, and performing general math functions over the data in a channel, such as unit conversion or time derivatives. A formula is a variable built from other variables, such as ac above, which multiplies aa and ab.
The Custom formula window has its own reference which shows supported operators and the available variables with their variable names and display names.
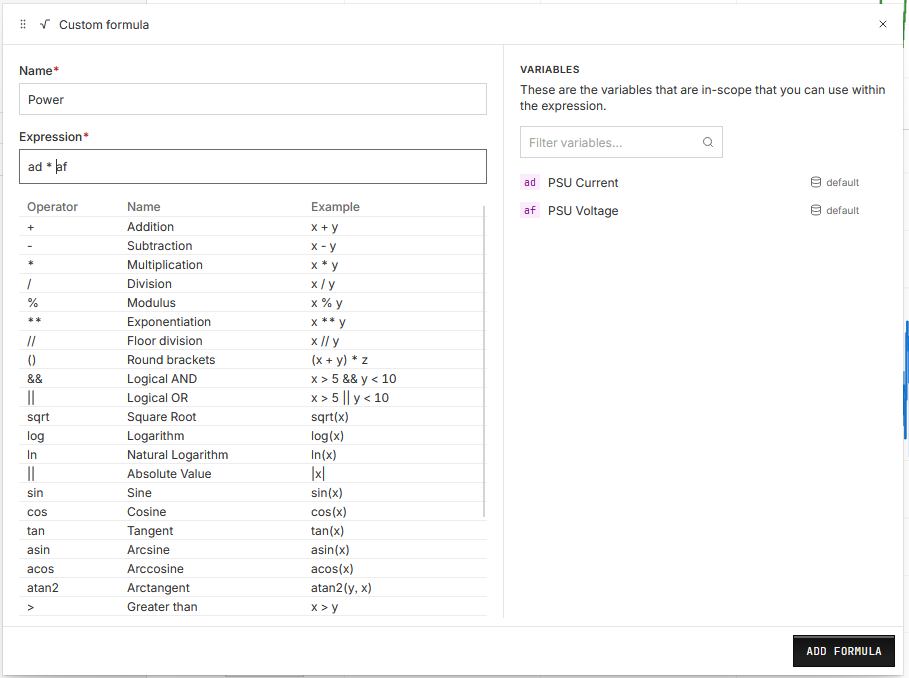
A formula’s inputs don’t need to be recorded at the same rate. The output of the formula uses the first variable in the formula as a timing source. Each other input contributes its most recent point from up to 1 second before. Where another input has no point in that second, the formula has no value. To override this default, you can deliberately 🔒︎resample the inputs to a common interval first.
When a unit doesn’t record a channel#
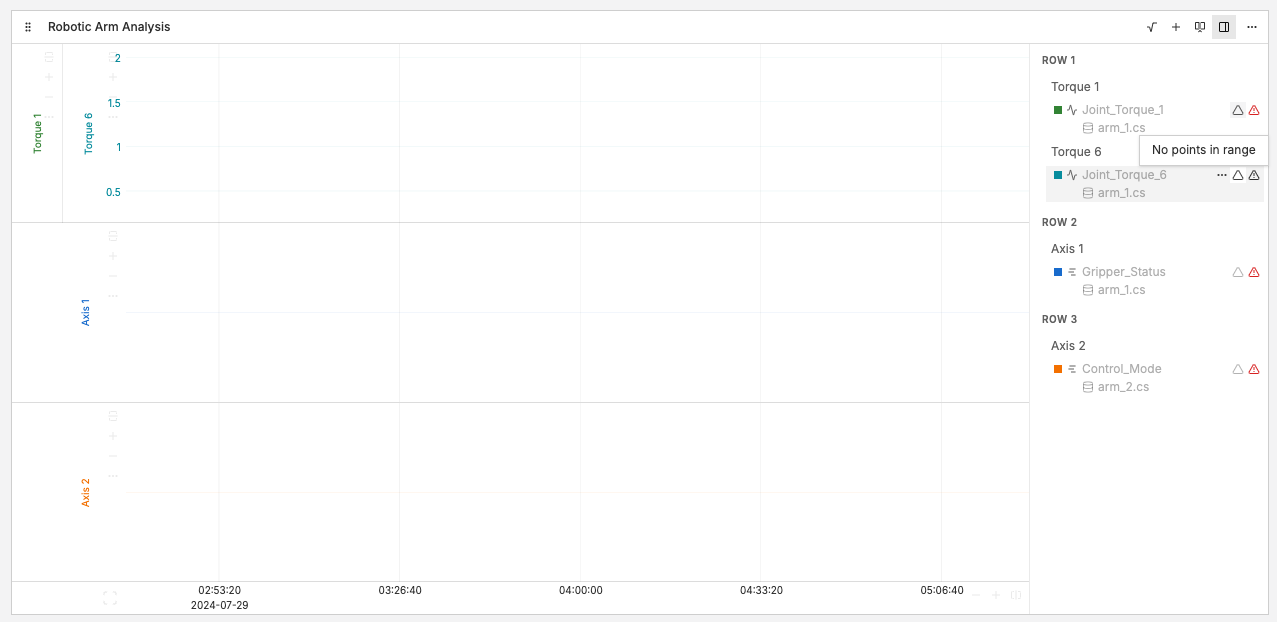
When an asset lacks a channel that a workbook uses, only the variables that reference that channel, and formulas built on them, stop plotting for that asset. The rest of the workbook keeps working, and the affected legend entries show a warning:
Add calculations to the template#
Add calculations to the console template, so every new workbook made from it gets them.
In the sidebar, click Workbooks, then the Templates tab, and open your console template. A published template is read-only: click EDIT TEMPLATE, enter a name under New draft, and click NEW DRAFT.
Preview the draft against one unit’s asset, so channel search lists that unit’s channels.
Add the channels the calculation uses as variables, by plotting them or adding them from channel search.
In the VARIABLES section, click + and choose Custom formula.
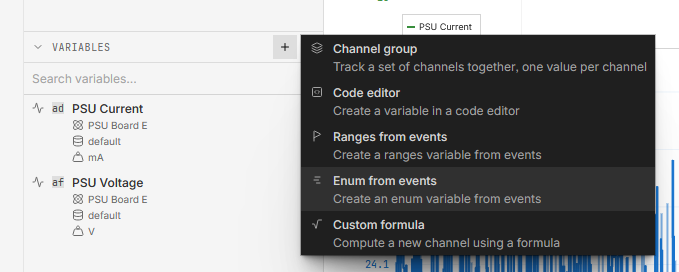
Enter a Name and an Expression, using the variable names listed under VARIABLES. For example,
sqrt(aa**2 + ab**2).Click ADD FORMULA.
Click PUBLISH, choose Publish as latest version…, enter a Message, and click PUBLISH. The draft’s changes don’t reach the template until you do.
Workbooks already made from the template keep their old layout. To add the calculation to one, follow the steps below.
Add calculations to one workbook#
Add a calculation to one unit’s workbook to try it out, to give it to that unit only, or to add it to a workbook made before the template changed. It doesn’t change the template or any other workbook.
Add the channels the calculation uses to the workbook as variables, by plotting them or adding them from channel search.
In the VARIABLES section, click + and choose Custom formula.
Enter a Name and an Expression, using the variable names listed under VARIABLES. For example,
sqrt(aa**2 + ab**2).Click ADD FORMULA.
Next steps#
Repeatable test execution: record each test as a run and compare runs afterwards.
Automated pass/fail checks: have checks flag problems as the data arrives.