

Repeatable test execution#
Story: “I have a static test station and need to execute tests repeatably and compare their results.”
This page is for engineers who run the same tests on hardware that rarely changes, and need every run recorded the same way so results can be compared and kept on record.
How to organize your data#
In general, users with this story should use the default approach. In this approach, there is a single asset per unit/device under test (UUT/DUT) and a single dataset per UUT which stores every scrap of data associated with the unit. The same ref name, like default, is used for every asset-to-dataset link. To find and identify each test case, runs mark the duration of the test.
        ---
config:
  layout: elk

---
flowchart BT
    classDef green fill:#dcfce7,stroke:#15803d,color:#1f2937
    classDef red fill:#fee2e2,stroke:#b91c1c,color:#1f2937
    classDef purple fill:#e0e7ff,stroke:#4338ca,color:#1f2937
    classDef blue fill:#e0f2fe,stroke:#0369a1,color:#1f2937

    asset1["Asset: UUT1"]:::green
    dataset1[("Dataset<br>UUT1")]:::purple
    dataset1 -->|"ref name=default"| asset1

    run1["Run: Test A"]:::red
    asset1 --> run1
    run2["Run: Test B"]:::red
    asset1 --> run2
    workbook1["Workbook for<br>Test Results<br><br>Points at one run at a time"]:::blue
    run1 -.->|"pointing at A"| workbook1
    run2 -.->|"pointing at B"| workbook1

    click asset1 href "../../../#asset" "Asset"
    click dataset1 href "../../../#time-series-data" "Time-series data"
    click run1,run2 href "../../../#runs" "Runs"
    click workbook1 href "../../../../workbooks/" "Workbooks"
Because every UUT uses the same ref name and channel names, analysis built on one UUT’s runs works on every UUT’s runs. Workbook templates give each new run or comparison a workbook with that analysis.
If a source shared by many units, such as a ground station, records data during their tests and tags it with the unit under test, see Combining the default and tagged approaches.
Walkthrough#
Set up each unit under test#
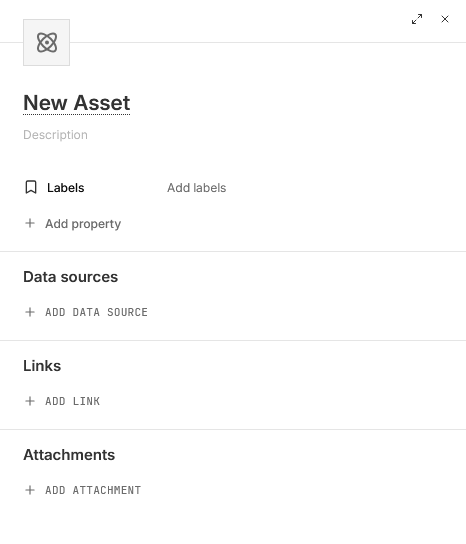
In the sidebar, click Assets, then NEW ASSET.
Give the asset a title, and add Labels and properties (Add property) that describe the unit.
Under Data sources, click ADD DATA SOURCE, then New dataset, or pick an existing dataset.
Under Refname, type
default, the same on every unit, and click Create “default”.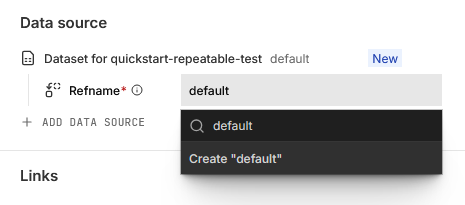
Click CREATE ASSET and then View asset in the notification.
To do the same in code and write a first point:
from nominal.core import NominalClient

client = NominalClient.from_profile("default")

# One asset per unit under test, with its own dataset attached under the ref name "default"
asset = client.create_asset("UUT1")
dataset = asset.get_or_create_dataset("default", name="UUT1")

# Write a point to the unit's dataset
with dataset.get_write_stream() as stream:
    stream.enqueue("Vsignal", "2026-01-01T12:00:00Z", 5.0)
use nominal::core::{AssetCreate, DatasetCreate};
use nominal::streaming::prelude::*;
use nominal::streaming::stream::NominalDatasetStreamBuilder;
use std::time::UNIX_EPOCH;

let client = nominal::NominalClient::from_profile("default")?;

// One asset per unit under test, with its own dataset attached under the ref name "default"
let asset = client.assets().create(AssetCreate::new("UUT1")).await?;
let dataset = client.catalog().create_dataset(DatasetCreate::new("UUT1")).await?;
client.assets().add_dataset(asset.rid(), "default", dataset.rid()).await?;

// Write a point to the unit's dataset
let token = BearerToken::new(&std::env::var("NOMINAL_TOKEN")?)?;
let stream = NominalDatasetStreamBuilder::new()
    .stream_to_core(token, ResourceIdentifier::new(dataset.rid())?, tokio::runtime::Handle::current())
    .build();
stream.double_writer(ChannelDescriptor::new("Vsignal")).push(UNIX_EPOCH.elapsed()?, 5.0);
client = nominal.Client.fromProfile();

% One asset per unit under test, with its own dataset attached under the ref name "default"
asset = client.getOrCreateAsset("UUT1");
dataset = asset.getOrCreateDataset("UUT1", "default");

% Write a point to the unit's dataset
stream = dataset.stream();
vsignal = stream.channel("Vsignal");
vsignal.push(datetime("now"), 5.0);
import (
	"time"

	"github.com/nominal-io/nominal-api-go/api/rids"
	assetapi "github.com/nominal-io/nominal-api-go/scout/asset/api"
	"github.com/nominal-io/nominal-api-go/scout/assets"
	"github.com/nominal-io/nominal-api-go/scout/catalog"
	runapi "github.com/nominal-io/nominal-api-go/scout/run/api"
	nominal "github.com/nominal-io/nominal-streaming-go"
)

// httpClient is a conjure-go-runtime httpclient.Client for your Nominal REST API URL,
// token is your API key as a bearertoken.Token, and apiKey is the same key as a string
catalogClient := catalog.NewCatalogServiceClient(httpClient)
assetClient := assets.NewAssetServiceClient(httpClient)

// One asset per unit under test, with its own dataset attached under the ref name "default"
dataset, _ := catalogClient.CreateDataset(ctx, token, catalog.CreateDataset{Name: "UUT1"})
assetClient.CreateAsset(ctx, token, assetapi.CreateAssetRequest{
	Title: "UUT1",
	DataScopes: []assetapi.CreateAssetDataScope{{
		DataScopeName: "default",
		DataSource:    runapi.NewDataSourceFromDataset(rids.DatasetRid(dataset.Rid)),
	}},
})

// Write a point to the unit's dataset
streamClient, _ := nominal.NewClient(apiKey)
stream, _, _ := streamClient.NewDatasetStream(ctx, dataset.Rid.String())
stream.FloatStream("Vsignal").Enqueue(time.Now().UnixNano(), 5.0)
stream.Close()
Record each test as a run#
On the asset’s page, click the arrow beside NEW WORKBOOK in the top right and choose New run. You can also create a run by selecting the Runs tab and pressing NEW RUN.
Give the run a title, and set its Start to when the test began. Leave End empty while the test is running. If the test is already over, set End too, or, if the asset’s files cover the test, click Add files under Determine bounds with files and pick the files to set both from them.
Add labels and properties for the test, such as the procedure or its revision, and click CREATE RUN.
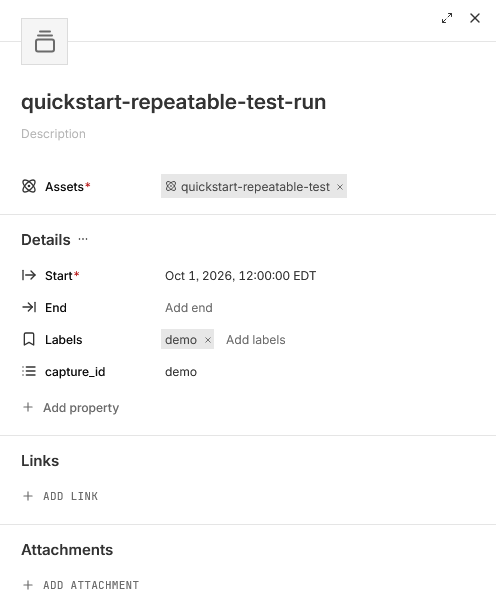
If you left End empty, set it under Details on the run’s page once the test is over and its data is in.
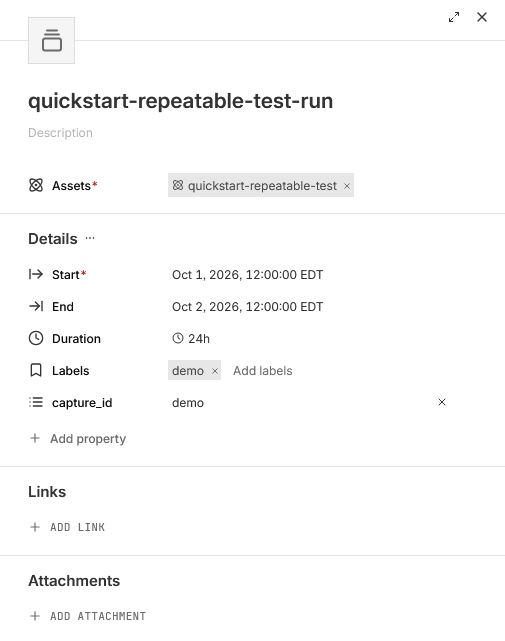
When you upload test files with the upload wizard, you can create the run in the same step by turning on Create run. To create runs from code, see Creating run metadata.
Build the analysis once#
On a run’s page, click NEW WORKBOOK and plot the channels the test is judged on.
Open the workbook menu (the logo ▾ at the top left) and choose File ▸ New template.
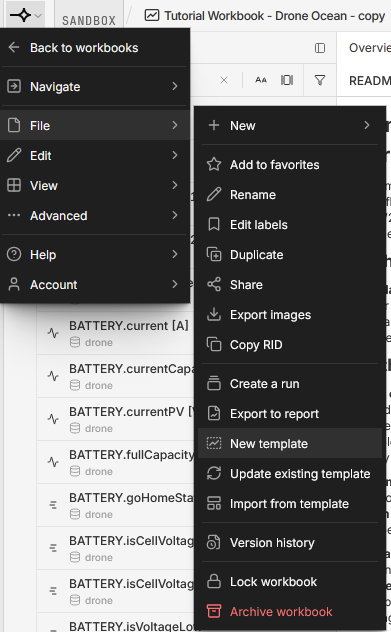
In the template editor, preview it against a run, then click PUBLISH, enter a Message, and click PUBLISH.
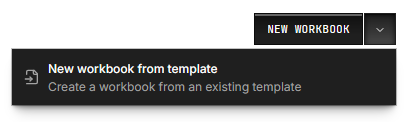
For each new run, click the arrow beside NEW WORKBOOK and choose New workbook from template.
Compare runs#
Once you’ve recorded a few tests as runs, as in Record each test as a run, overlay them on one timeline:
In a run’s workbook, click the Data icon in the left sidebar to open the DATA panel, then click Add data at the top of the panel.
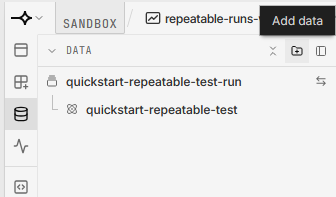
If a menu opens, choose New group, so each run stays separate. Select the other runs and click ADD RUN TO THIS WORKBOOK. With several runs selected, the button counts them, such as ADD 3 RUNS TO THIS WORKBOOK.
To line the runs up, click Align data groups in the DATA panel’s header, choose Align by group, set Align to to Start, and click APPLY.
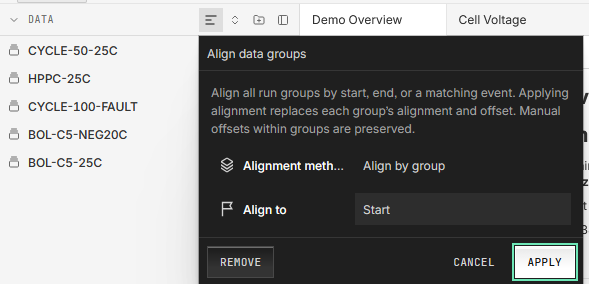
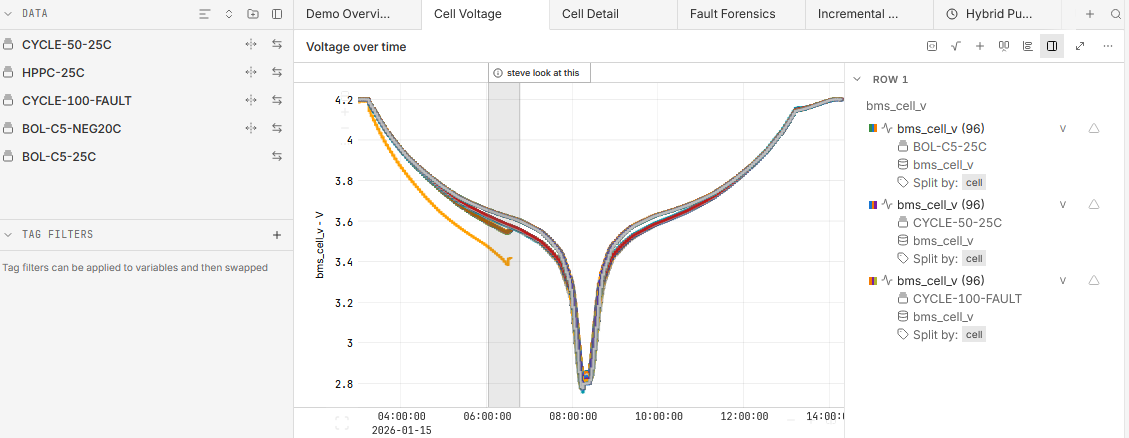
To move a single run instead, see Line up tests on one timeline.
To compare summary numbers across many runs instead, such as each run’s peak temperature, click Workbooks in the sidebar, then the arrow beside NEW WORKBOOK, and choose New comparison workbook. See 🔒︎Comparison workbooks.
Coming from test station development#
If your units’ data is already in one dataset tagged by unit, as in Test station development, you don’t need to start over. Handle transitions between approaches by giving each unit an asset, and later a dataset, on top of the data you’ve already recorded.
Next steps#
Automated pass/fail checks: check every run against its limits.
The default approach: its extensions for multiple data sources and tester monitoring.
Combining the default and tagged approaches: each unit’s own dataset alongside a shared source tagged by unit.
Using workbook templates: open the same analysis on any asset or run.
🔒︎Multi-run workbooks: overlay and align runs on a shared timeline.