

Test station development#
Story: “I build and rework test rigs while the hardware is still changing. I want to see my data right away, and decide how to organize it once I know what it is.”
This page is for engineers who develop test stations while the hardware on them is still in development. Boards get swapped, instruments get added, the channel list and specifications change from one week to the next, and the right structure isn’t known yet. If you’re developing the board itself, on a handful of dev boards, see Controller development instead.
The quick visualization approach is good for one-off testing, but a test station engineer needs the same flexibility while keeping the history of their work for analysis and feedback cycles.
Start by implementing the tagged approach. Once your tests settle into a routine, give each unit an asset of its own on the station’s dataset. Consider also giving each unit a dataset of its own only if the units themselves are long-lived, tested over many campaigns, or have data of their own, such as an onboard recorder. That combines the default and tagged approaches. See also the Repeatable test execution story.
While the station keeps changing#
Create one asset for the station and one dataset. Everything the station records goes into the dataset, which is linked to the asset under the ref name default.
To tell boards and setups apart, put tags on your data, such as board=A or config=2, or any other key and value you would find valuable.
Because the station’s asset is linked to the whole dataset with no tag filter, a workbook on the station’s asset also lets you monitor the station itself.
        ---
config:
  layout: elk

---
flowchart BT
    classDef purple fill:#e0e7ff,stroke:#4338ca,color:#1f2937
    classDef darkgreen fill:#bbf7d0,stroke:#15803d,color:#1f2937

    subgraph dataset1["Dataset: Test station"]
        row2["<u>Tuesday</u><br>board=B<br>config=1<br><br>10:30:00 · 11.8<br>10:30:01 · 11.9<br>..."]:::purple
        row3["<u>Thursday</u><br>board=B<br>config=2<br><br>14:15:00 · 13.0<br>14:15:01 · 12.8<br>..."]:::purple
        row1["<u>Monday</u><br>board=A<br>config=1<br><br>09:00:00 · 12.1<br>09:00:01 · 12.3<br>..."]:::purple
    end
    style dataset1 fill:#f5f7ff,stroke:#4338ca,color:#1f2937

    station["Asset: Test station"]:::darkgreen
    dataset1 -->|"ref name=default"| station

    click station href "../../../#asset" "Asset"
    click dataset1,row1,row2,row3 href "../../../#time-series-data" "Time-series data"
By tagging the data you can look at just a portion of it in your workbooks, filtering the data for board=A or config=2 or both.
Walkthrough: upload with tags#
In the sidebar, click + (New), then Upload data, and add your files.
Click SELECT A DESTINATION:
The first time, choose Create an asset, name it after the station, and click CREATE ASSET.
After that, choose Link to an existing asset and pick the station.
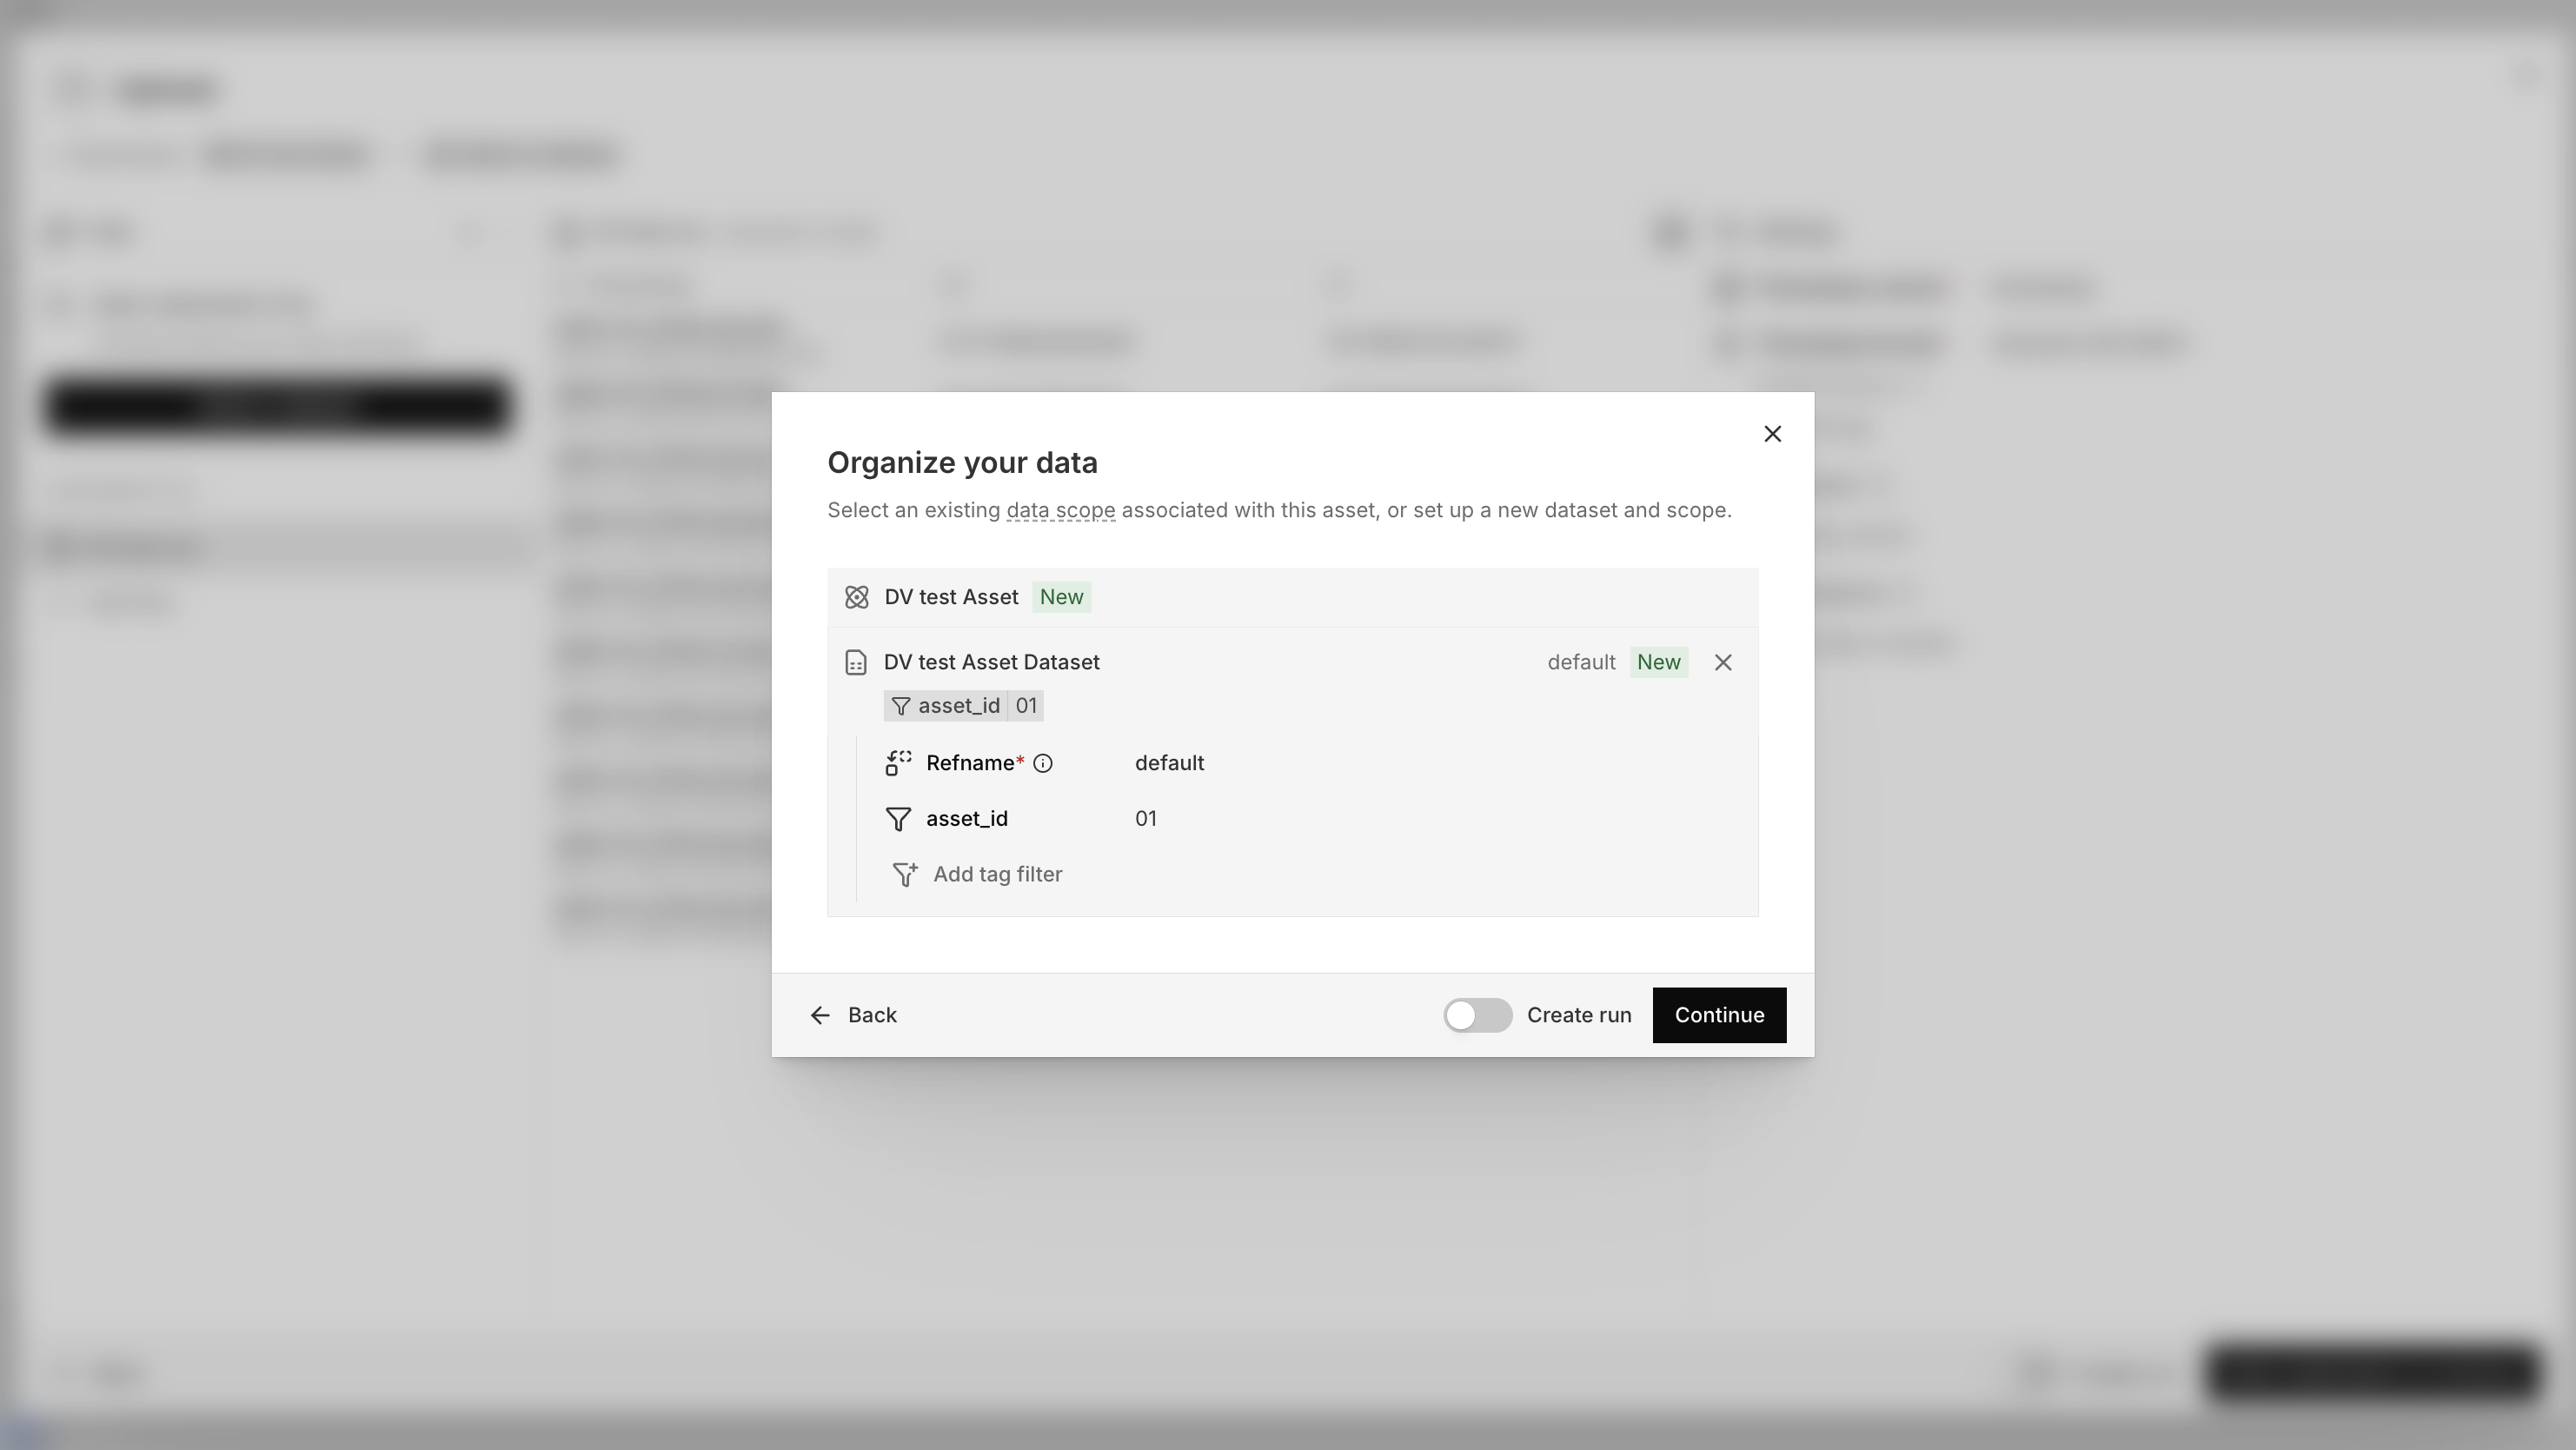
In Organize your data:
The first time, click ADD DATA, then New dataset, name it, and click CREATE DATASET. Keep the Refname
default, then click CONTINUE.After that, click the station’s existing data scope.
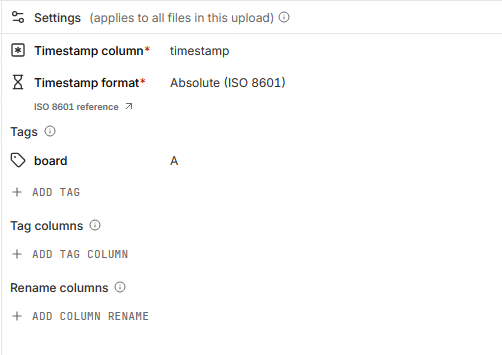
In the Settings panel, check the timestamp, then under Tags click ADD TAG to tag everything in the upload, for example
board=A. If a column in the file already says which unit each row came from, use ADD TAG COLUMN under Tag columns instead.Turn on Create run, name the run, and click CREATE RUN, so the workbook you open next shows just this upload’s time range.
Click CONFIRM & INGEST, then VIEW RUN, then NEW WORKBOOK.
To stream instead, attach the tags to the data you write. In Python:
from nominal.core import NominalClient

client = NominalClient.from_profile("default")
dataset = client.get_dataset("<ri.catalog.instance.dataset.identifier>")  # the station's dataset

with dataset.get_write_stream() as stream:
    stream.enqueue("voltage", "2026-01-01T12:00:00Z", 12.1, tags={"board": "A", "config": "1"})
If instro is used to drive the station’s instruments, create the instruments for each unit and pass that unit’s tags to each constructor. Everything an instrument reads or sends then carries those tags:
from instro.psu import InstroPSU
from instro.psu.drivers import BK9115


def run_test(board: str) -> None:
    psu = InstroPSU(
        name="psu",
        driver=BK9115("<VISA resource>"),
        num_channels=1,
        dataset_rid="<ri.catalog.instance.dataset.identifier>",  # the station's dataset
        board=board,  # other keyword arguments become tags on every point
    )
    with psu:  # opens the instrument, and closes it when the test ends
        ...  # the test sequence


run_test("A")  # once board B is in the socket, run_test("B")
instro’s test rack example drives a power supply, an electronic load, and a DAQ into one dataset.
To look at one board at a time in a workbook on the station, filter by the board tag. To compare boards side by side, split by it instead.
Filter by a tag#
Show only the points with certain tag values:
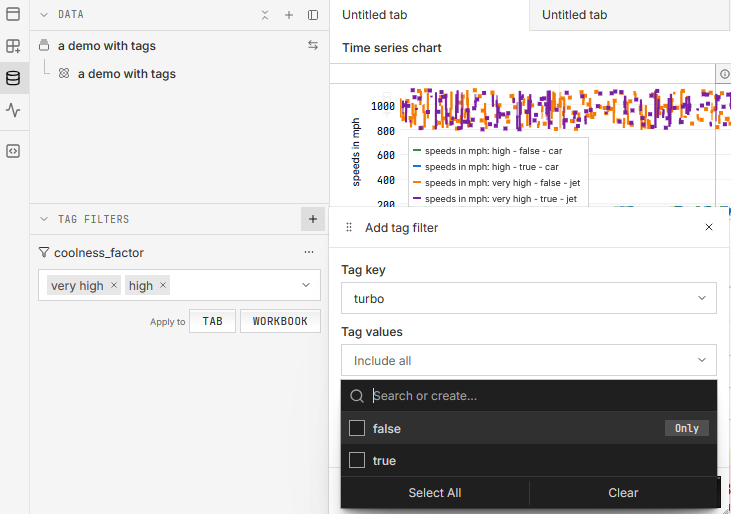
In the workbook’s left sidebar, click the Data icon to open the DATA panel.
In its TAG FILTERS section, click + (Add tag filter). Choose the Tag key, pick the values under Tag values, and click ADD TAG FILTER.
On the filter’s row, after Apply to, click TAB to filter every variable in the current tab, or WORKBOOK for every variable in the workbook.
Split by a tag#
Plot each tag value as its own series by splitting the variable that plots the channel:
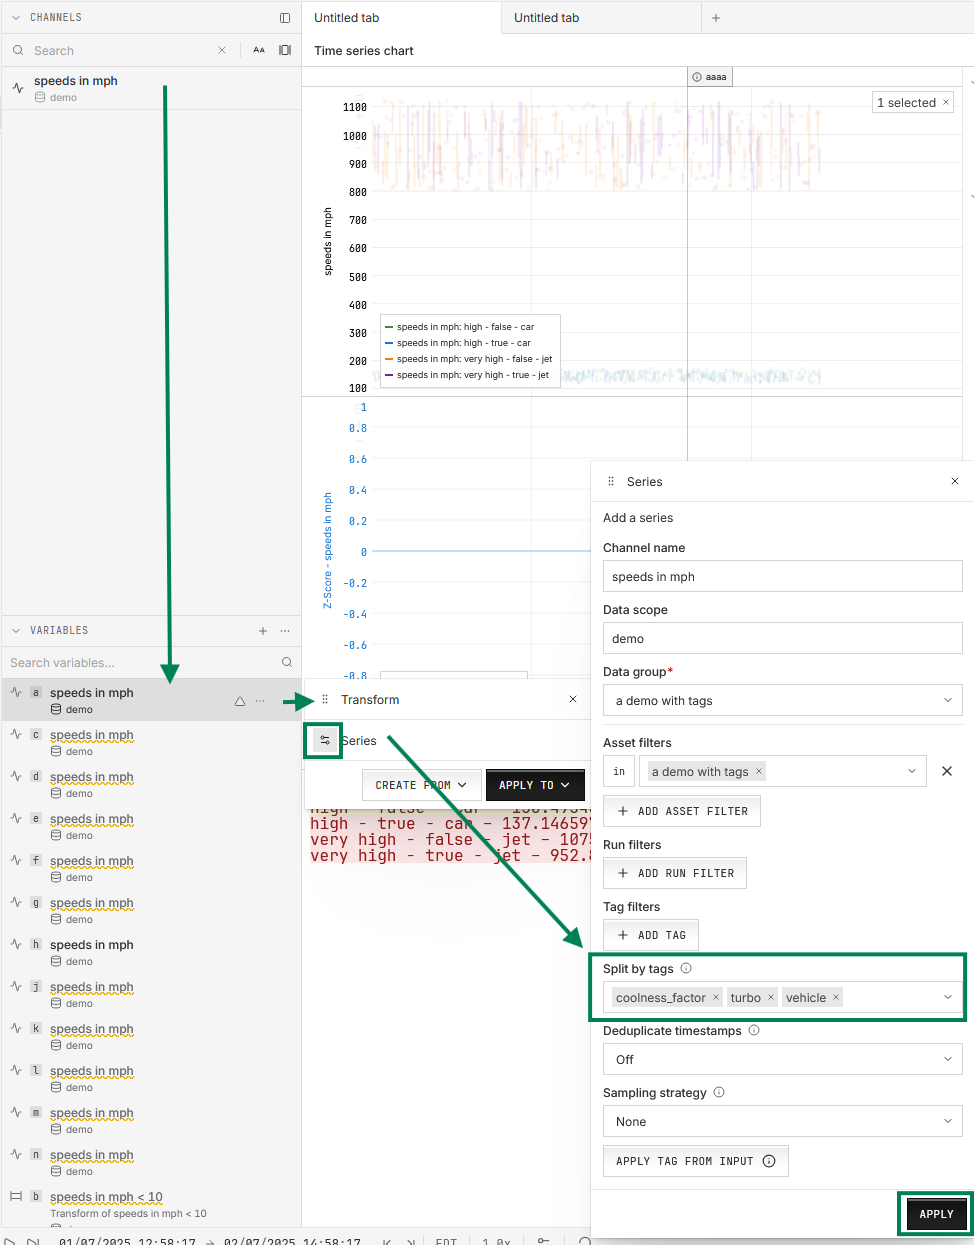
In the left sidebar’s Channels & variables view, find the VARIABLES section, hover over the variable, and click its Transform icon.
In the Transform window, click the settings icon on the Series row.
In the Series window, choose the tag under Split by tags, and click APPLY.
Monitor the station itself#
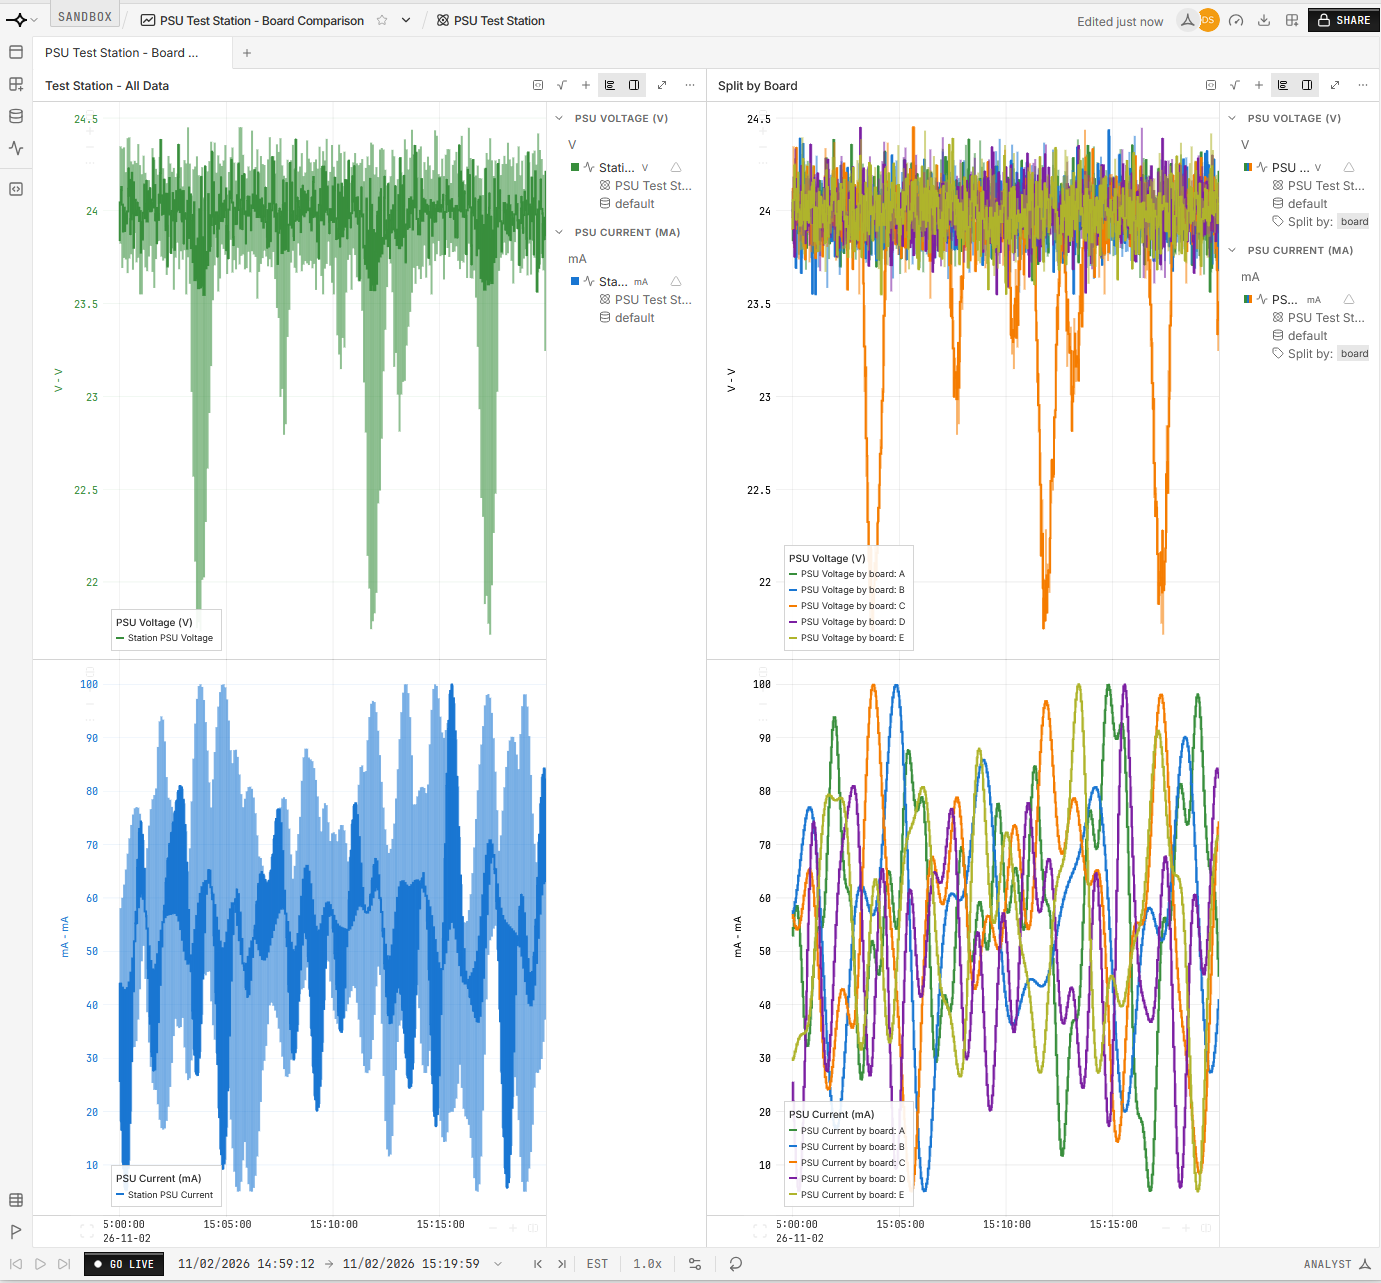
Comparing units tells you how each one performed, but as a test station engineer you may also need to validate the test station itself is working. Is an instrument drifting? A voltage source slowly sagging? The station’s asset already lets you watch for problems like these.
With the tagged approach set up above, every measurement the station has taken is in its one dataset. A single workbook on the station’s asset can plot all of the station’s signals over time, where problems such as supply voltage drift or rising signal noise show up. When you find one, split by the board tag to tell whether it comes from a unit or from the station.
Instro also writes each command it sends to a channel ending in .cmd. E.g. a measurement of psu.ch1.voltage will be recorded alongside psu.ch1.voltage.cmd. This allows a test engineer to look for failures where a setpoint is not reached.
        ---
config:
  layout: elk

---
flowchart BT
    classDef purple fill:#e0e7ff,stroke:#4338ca,color:#1f2937
    classDef blue fill:#e0f2fe,stroke:#0369a1,color:#1f2937
    classDef darkgreen fill:#bbf7d0,stroke:#15803d,color:#1f2937

    subgraph dataset1["Dataset: Test station"]
        unitA["<u>Monday</u><br>board=A<br><br>09:00:00 · 12.1<br>..."]:::purple
        unitB["<u>Tuesday</u><br>board=B<br><br>10:30:00 · 11.8<br>..."]:::purple
    end
    style dataset1 fill:#f5f7ff,stroke:#4338ca,color:#1f2937

    station["Asset: Test station"]:::darkgreen
    dataset1 -->|"ref name=default<br>no filter"| station

    workbook1["Workbook for<br>Station health<br><br>Every point, every board"]:::blue
    station --> workbook1

    click station href "../../../#asset" "Asset"
    click dataset1,unitA,unitB href "../../../#time-series-data" "Time-series data"
    click workbook1 href "../../../../workbooks/" "Workbooks"
Walkthrough: check the station’s health#
In the sidebar, click Assets and open the station’s asset, the one you created in your first upload, then click NEW WORKBOOK.
Plot the station’s own signals, such as its supply voltage, and widen the time range to cover several weeks of tests.
To tell the station from the units, split the signal’s variable by
board: in the VARIABLES section, click the variable’s Transform icon, then the settings icon on the Series row, chooseboardunder Split by tags, and click APPLY.
Next steps#
As the design stabilizes, give each unit an asset of its own.
Detailed guides:
Using a single dataset for many identical assets: the tagged approach in full.
The default approach: one asset and dataset per unit, and production tester monitoring.
Combining the default and tagged approaches: units with datasets of their own alongside the station’s tagged dataset.