

Quick visualization#
Story: “I have data right now and I want to see it right now. I’m not worried about organizing it yet.”
This page is for data that isn’t well organized yet but is still worth sending to Nominal for visualization and long-term storage. It takes the fewest steps to upload your data and see it, fast.
Quick visualization only needs the dataset portion of the data model. A dataset contains a set of named channels. Each channel has a collection of (time, value) points.
Uploading data#
In the Nominal app, upload a natively supported file (such as CSV), or a file type with an extractor, and have the upload create a run. You plot data in a workbook, which can open on a run, so creating the run during upload gets you to a plot without setting anything else up. If you don’t have a file of your own, use sample.csv, a minute of test data.
In the sidebar, click + (New), then Upload data. Drop your files onto Upload files, or click SELECT FILES and locate your data on disk.
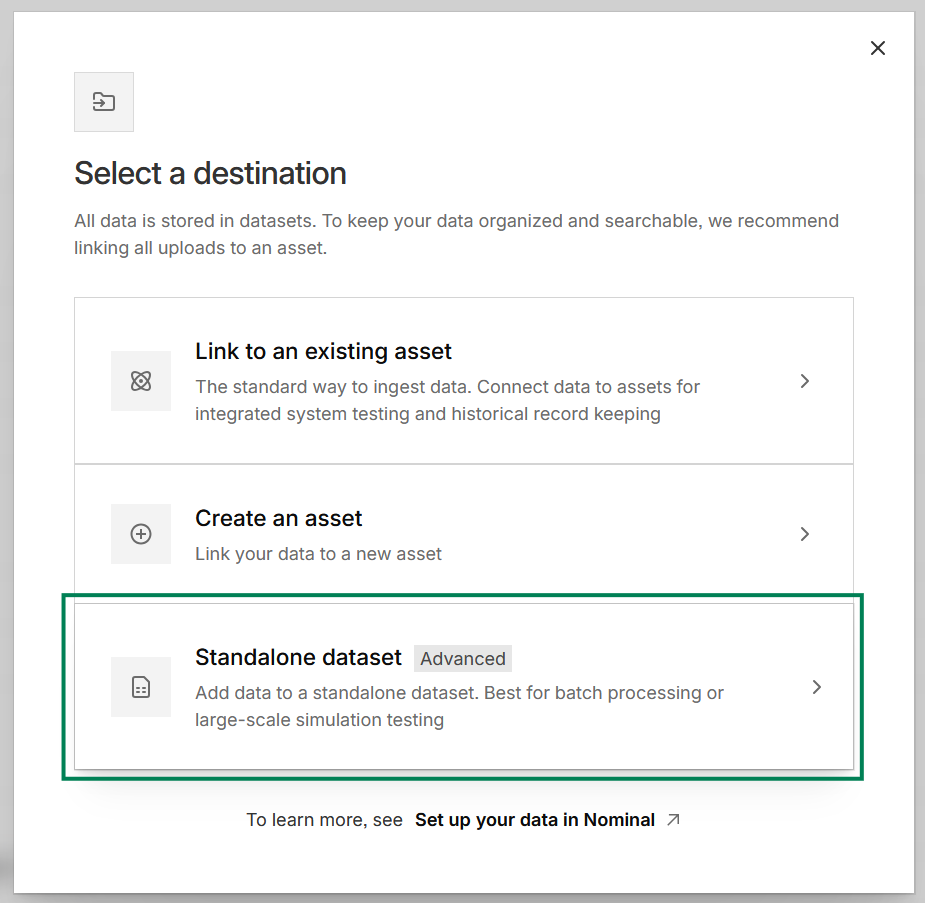
Click SELECT A DESTINATION and choose Standalone dataset. Pick a dataset, or click NEW DATASET to make one. For a new dataset, enter at least a name and select CREATE DATASET.
For a natively supported file, in the Settings panel, check the Timestamp column and Timestamp format against your data file and adjust to match. For a file type with an extractor, see Run an ingest: Web UI.
Turn on Create run, name the run, and click CREATE RUN.
Click CONFIRM & INGEST, then VIEW RUN.
Continue with visualizing data.
Using client tools#
Application developers can get live data into Nominal using one of the available client libraries, engineering tools such as NI TestStand or Simulink, or hardware integration libraries like Instro.
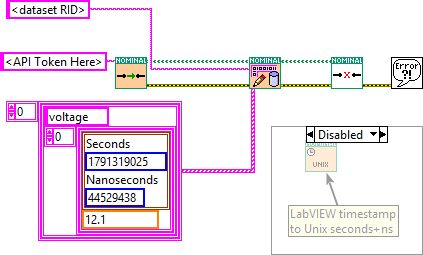
To get started programmatically, first use the Nominal app or your tool to create a dataset and get its RID, which has the form <ri.catalog.instance.dataset.identifier>.
To create a dataset and get its RID in the Nominal app:
In the sidebar, click + (New), then Upload data.
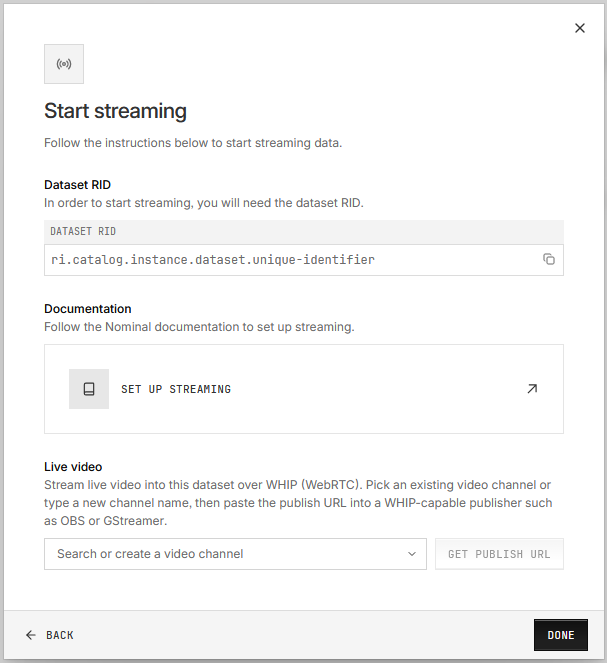
On the Stream data card, click SET UP.
Choose Standalone dataset [Advanced]. Pick a dataset, or click NEW DATASET, enter a name, and select CREATE DATASET.
The Start streaming step shows the Dataset RID. Copy it, then click DONE.
Once you have the RID, each tool allows you to enter the RID to stream to:
from datetime import datetime, timezone
from nominal.core import NominalClient

client = NominalClient.from_profile("default")

dataset_rid = "<ri.catalog.instance.dataset.identifier>"
dataset = client.get_dataset(dataset_rid)  # or client.create_dataset("My dataset")

# A run with no end stays open, so its workbook can go live
run = client.create_run("Quick look", start=datetime.now(timezone.utc), end=None)
run.add_dataset("default", dataset)  # "default" is the ref name

with dataset.get_write_stream() as stream:
    stream.enqueue("voltage", datetime.now(timezone.utc), 12.1)
# Start the simulator first, in another terminal: python -m instro.dmm.scpi_sim_server
from instro.dmm import InstroDMM
from instro.dmm.drivers import SimulatedDMM  # or Agilent34401A, Keysight34461A, Keithley2400
from instro.lib.publishers import NominalCorePublisher

dataset_rid = "<ri.catalog.instance.dataset.identifier>"

dmm = InstroDMM(
    name="dmm",
    driver=SimulatedDMM("TCPIP0::127.0.0.1::5026::SOCKET"),
    publishers=[NominalCorePublisher(dataset_rid=dataset_rid)],
)
with dmm:
    dmm.read_dc_voltage()  # published to the dataset
dataset_rid = "<ri.catalog.instance.dataset.identifier>";

client = nominal.Client.fromProfile();
dataset = client.datasetByRid(dataset_rid);

% A run starts on an asset; with no end it stays open, so its workbook can go live
asset = client.getOrCreateAsset("My asset");
asset.addDataset(dataset);
r = asset.run("Quick look");

stream = dataset.stream();
voltage = stream.channel("voltage");
voltage.push(datetime("now", TimeZone="UTC"), 12.1);
use nominal::core::RunCreate;
use nominal::streaming::prelude::*;
use nominal::streaming::stream::NominalDatasetStreamBuilder;

let client = nominal::NominalClient::from_profile("default")?;
let dataset_rid = "<ri.catalog.instance.dataset.identifier>";
// or create one: client.catalog().create_dataset(DatasetCreate::new("My dataset")).await?.rid()

// A run with no end stays open, so its workbook can go live
let run = client.runs().create(RunCreate::new("Quick look", chrono::Utc::now())).await?;
client.runs().add_dataset(run.rid(), "default", dataset_rid).await?; // "default" is the ref name

// token: your API key, as a BearerToken
let stream = NominalDatasetStreamBuilder::new()
    .stream_to_core(token, ResourceIdentifier::new(dataset_rid)?, tokio::runtime::Handle::current())
    .build();
stream.double_writer(ChannelDescriptor::new("voltage")).push(chrono::Utc::now(), 12.1);
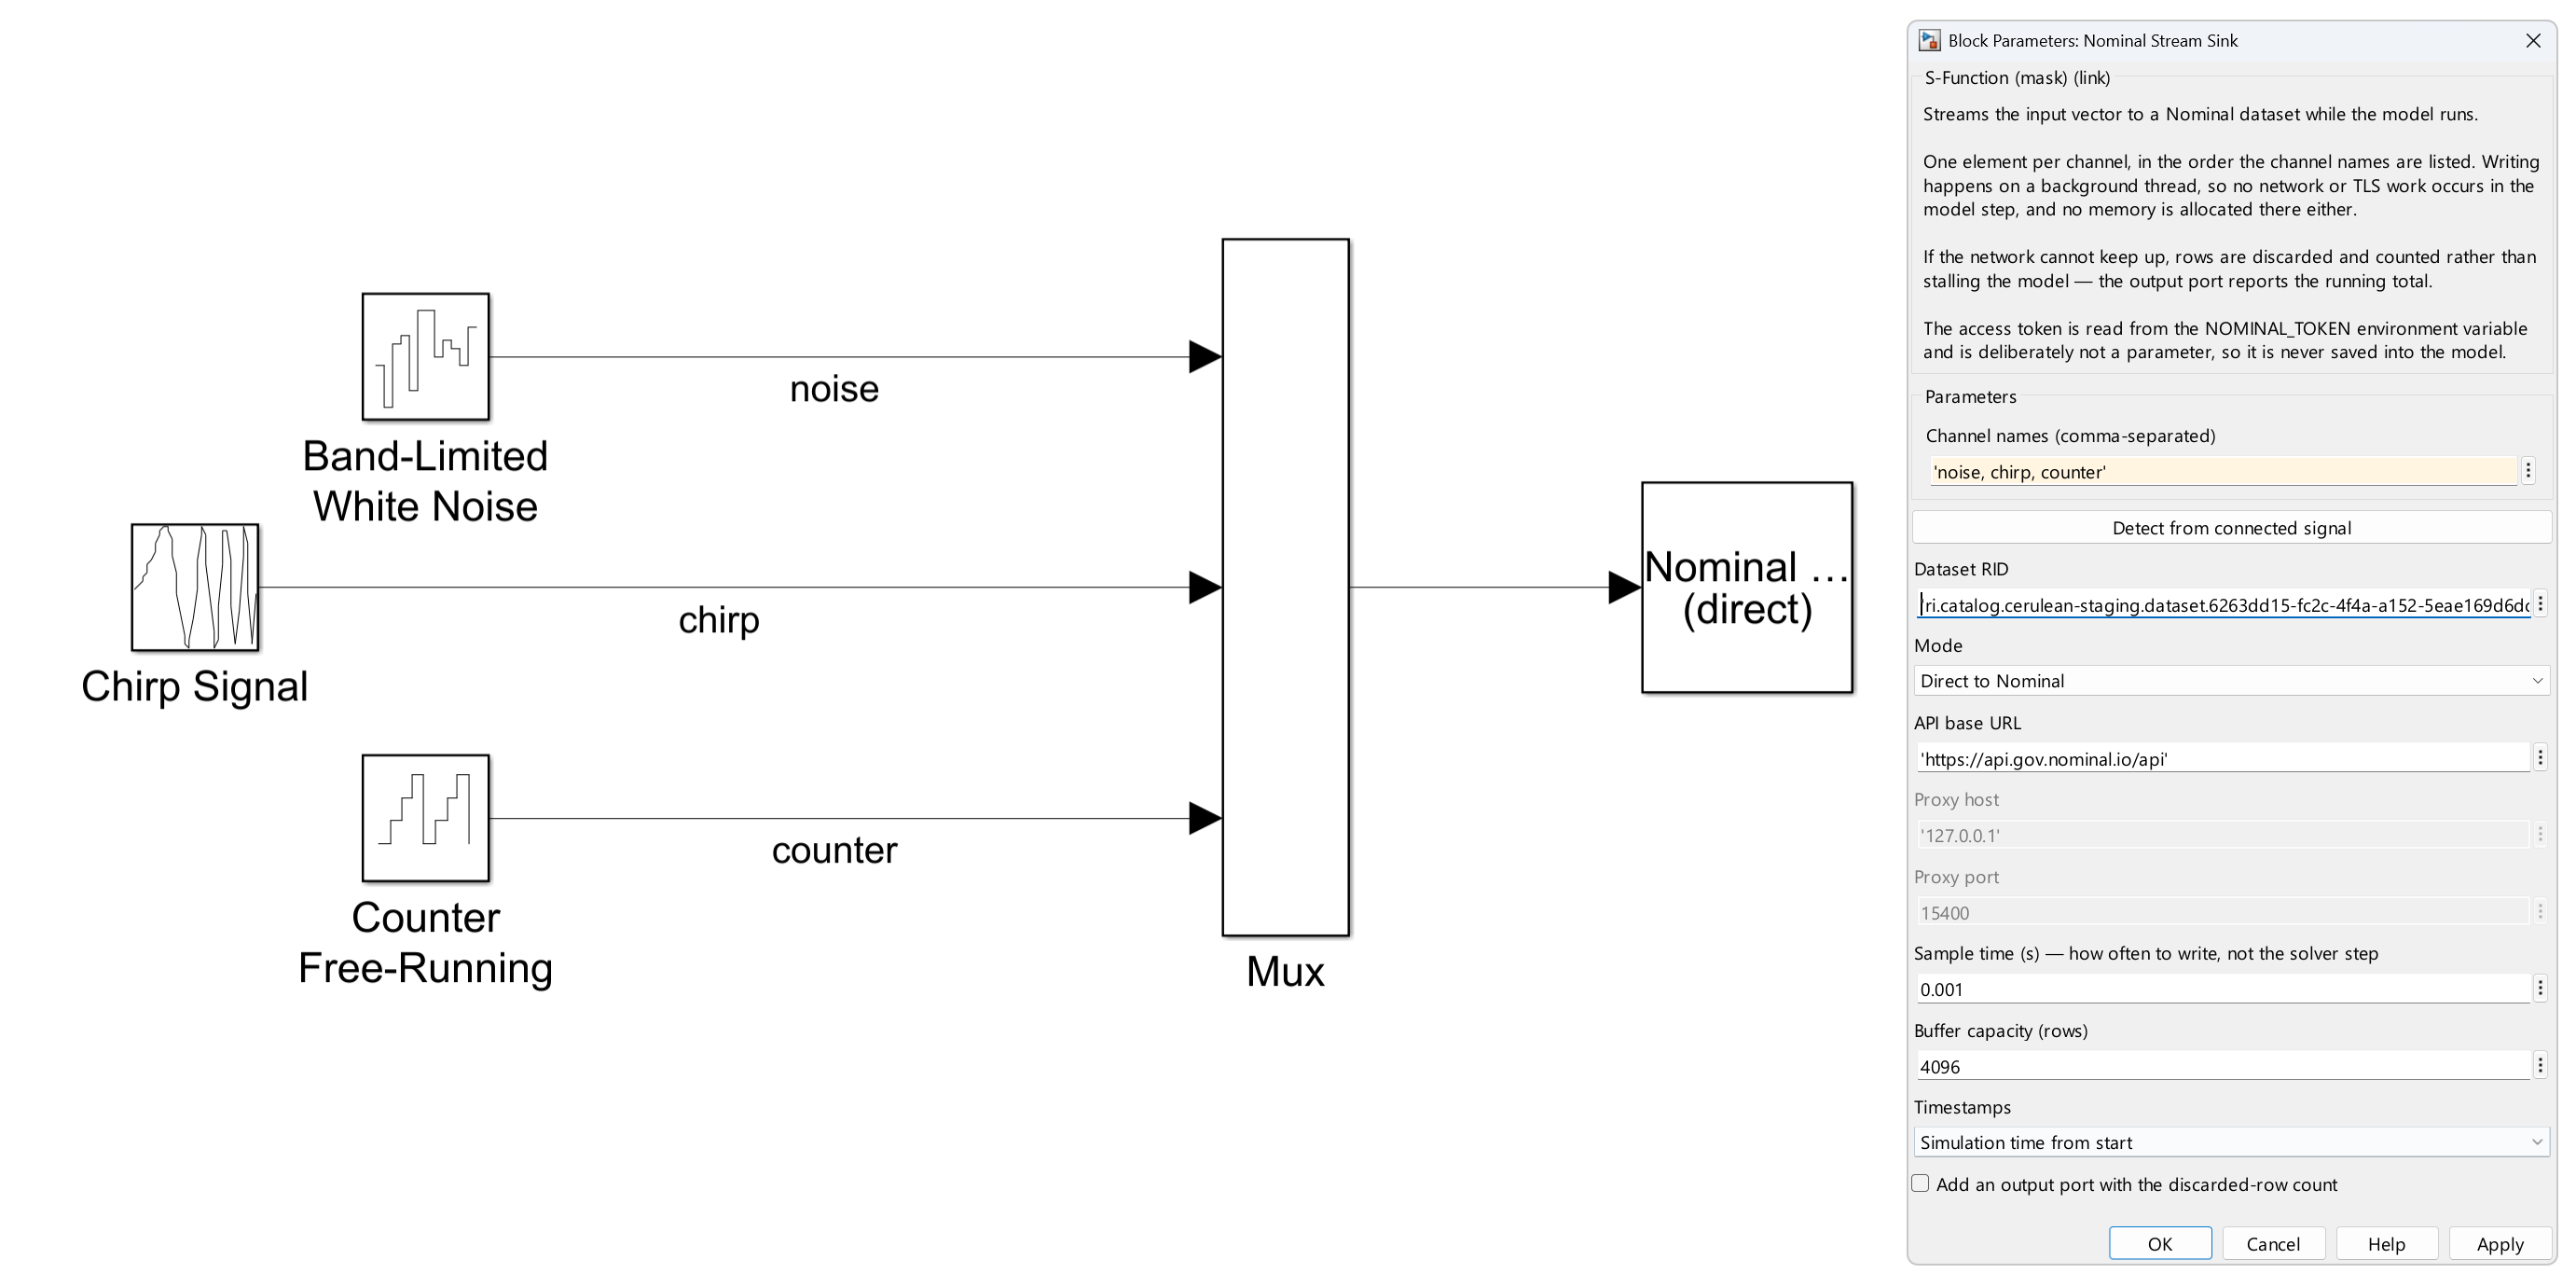
This is the example model from the Nominal Blockset’s Getting Started page. Open it in MATLAB with:
open_system(fullfile(nominal_root, 'examples', 'nominal_stream_example.slx'))
The Python, MATLAB, and Rust examples above also create a run. If your code only writes to a dataset, plot it with a quick plot. Either way, continue with visualizing data.
Visualizing data#
Both paths above end with a dataset, and many also create a run. A quick plot shows the dataset’s channels without a run or a workbook, which is enough to check that each channel is getting data and has the name you expect. For analysis in tabs and panels, open a workbook on the run.
From a dataset#
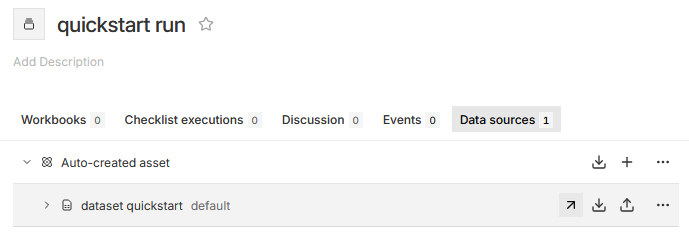
On the run’s page, click the Data sources tab, or Assets for a run on an asset you created, then the arrow beside your dataset. Without a run, in the sidebar, click Data, then Data sources, and open your dataset.
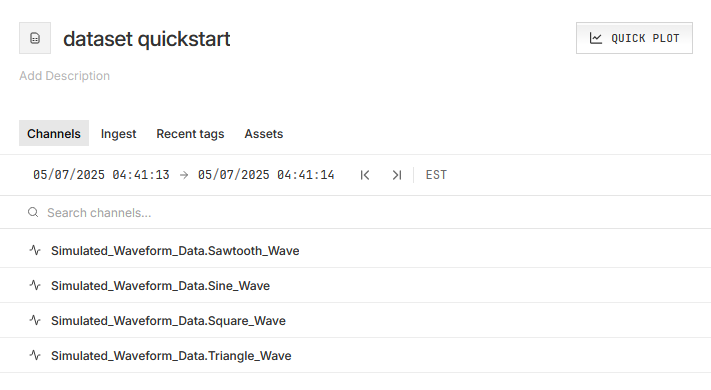
Click QUICK PLOT.
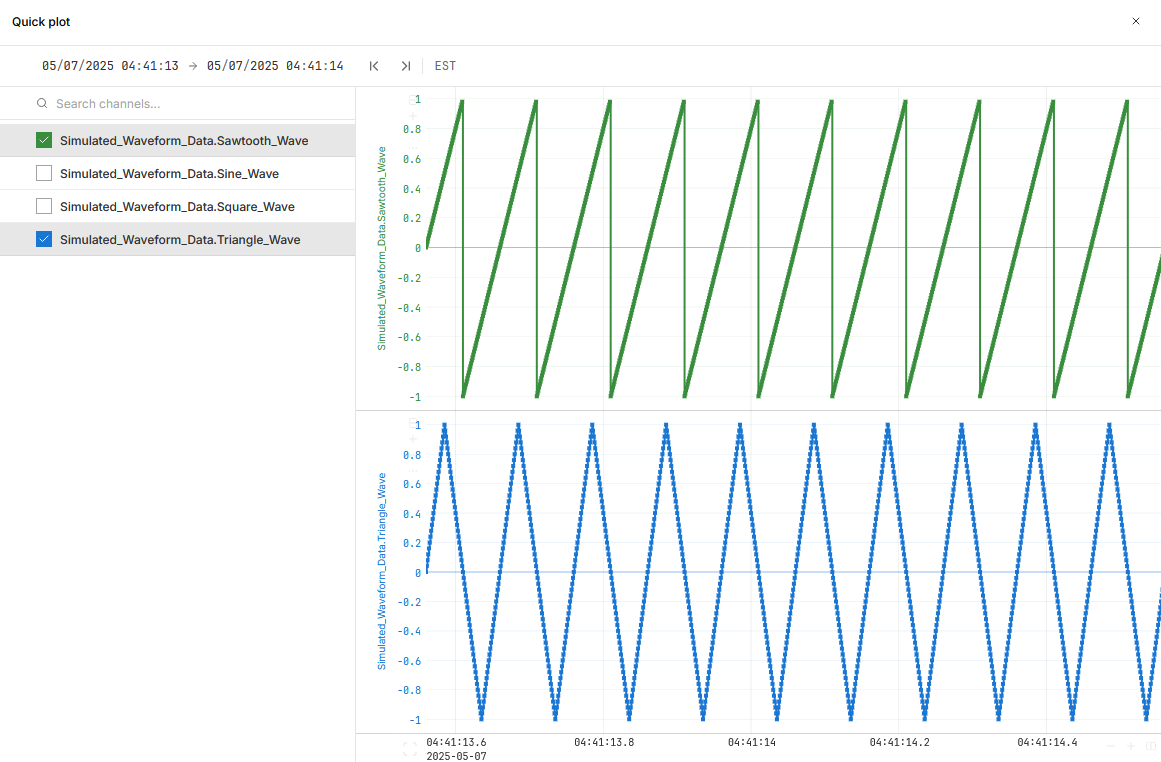
Check the channels to plot. Each one gets its own chart.
From a run#
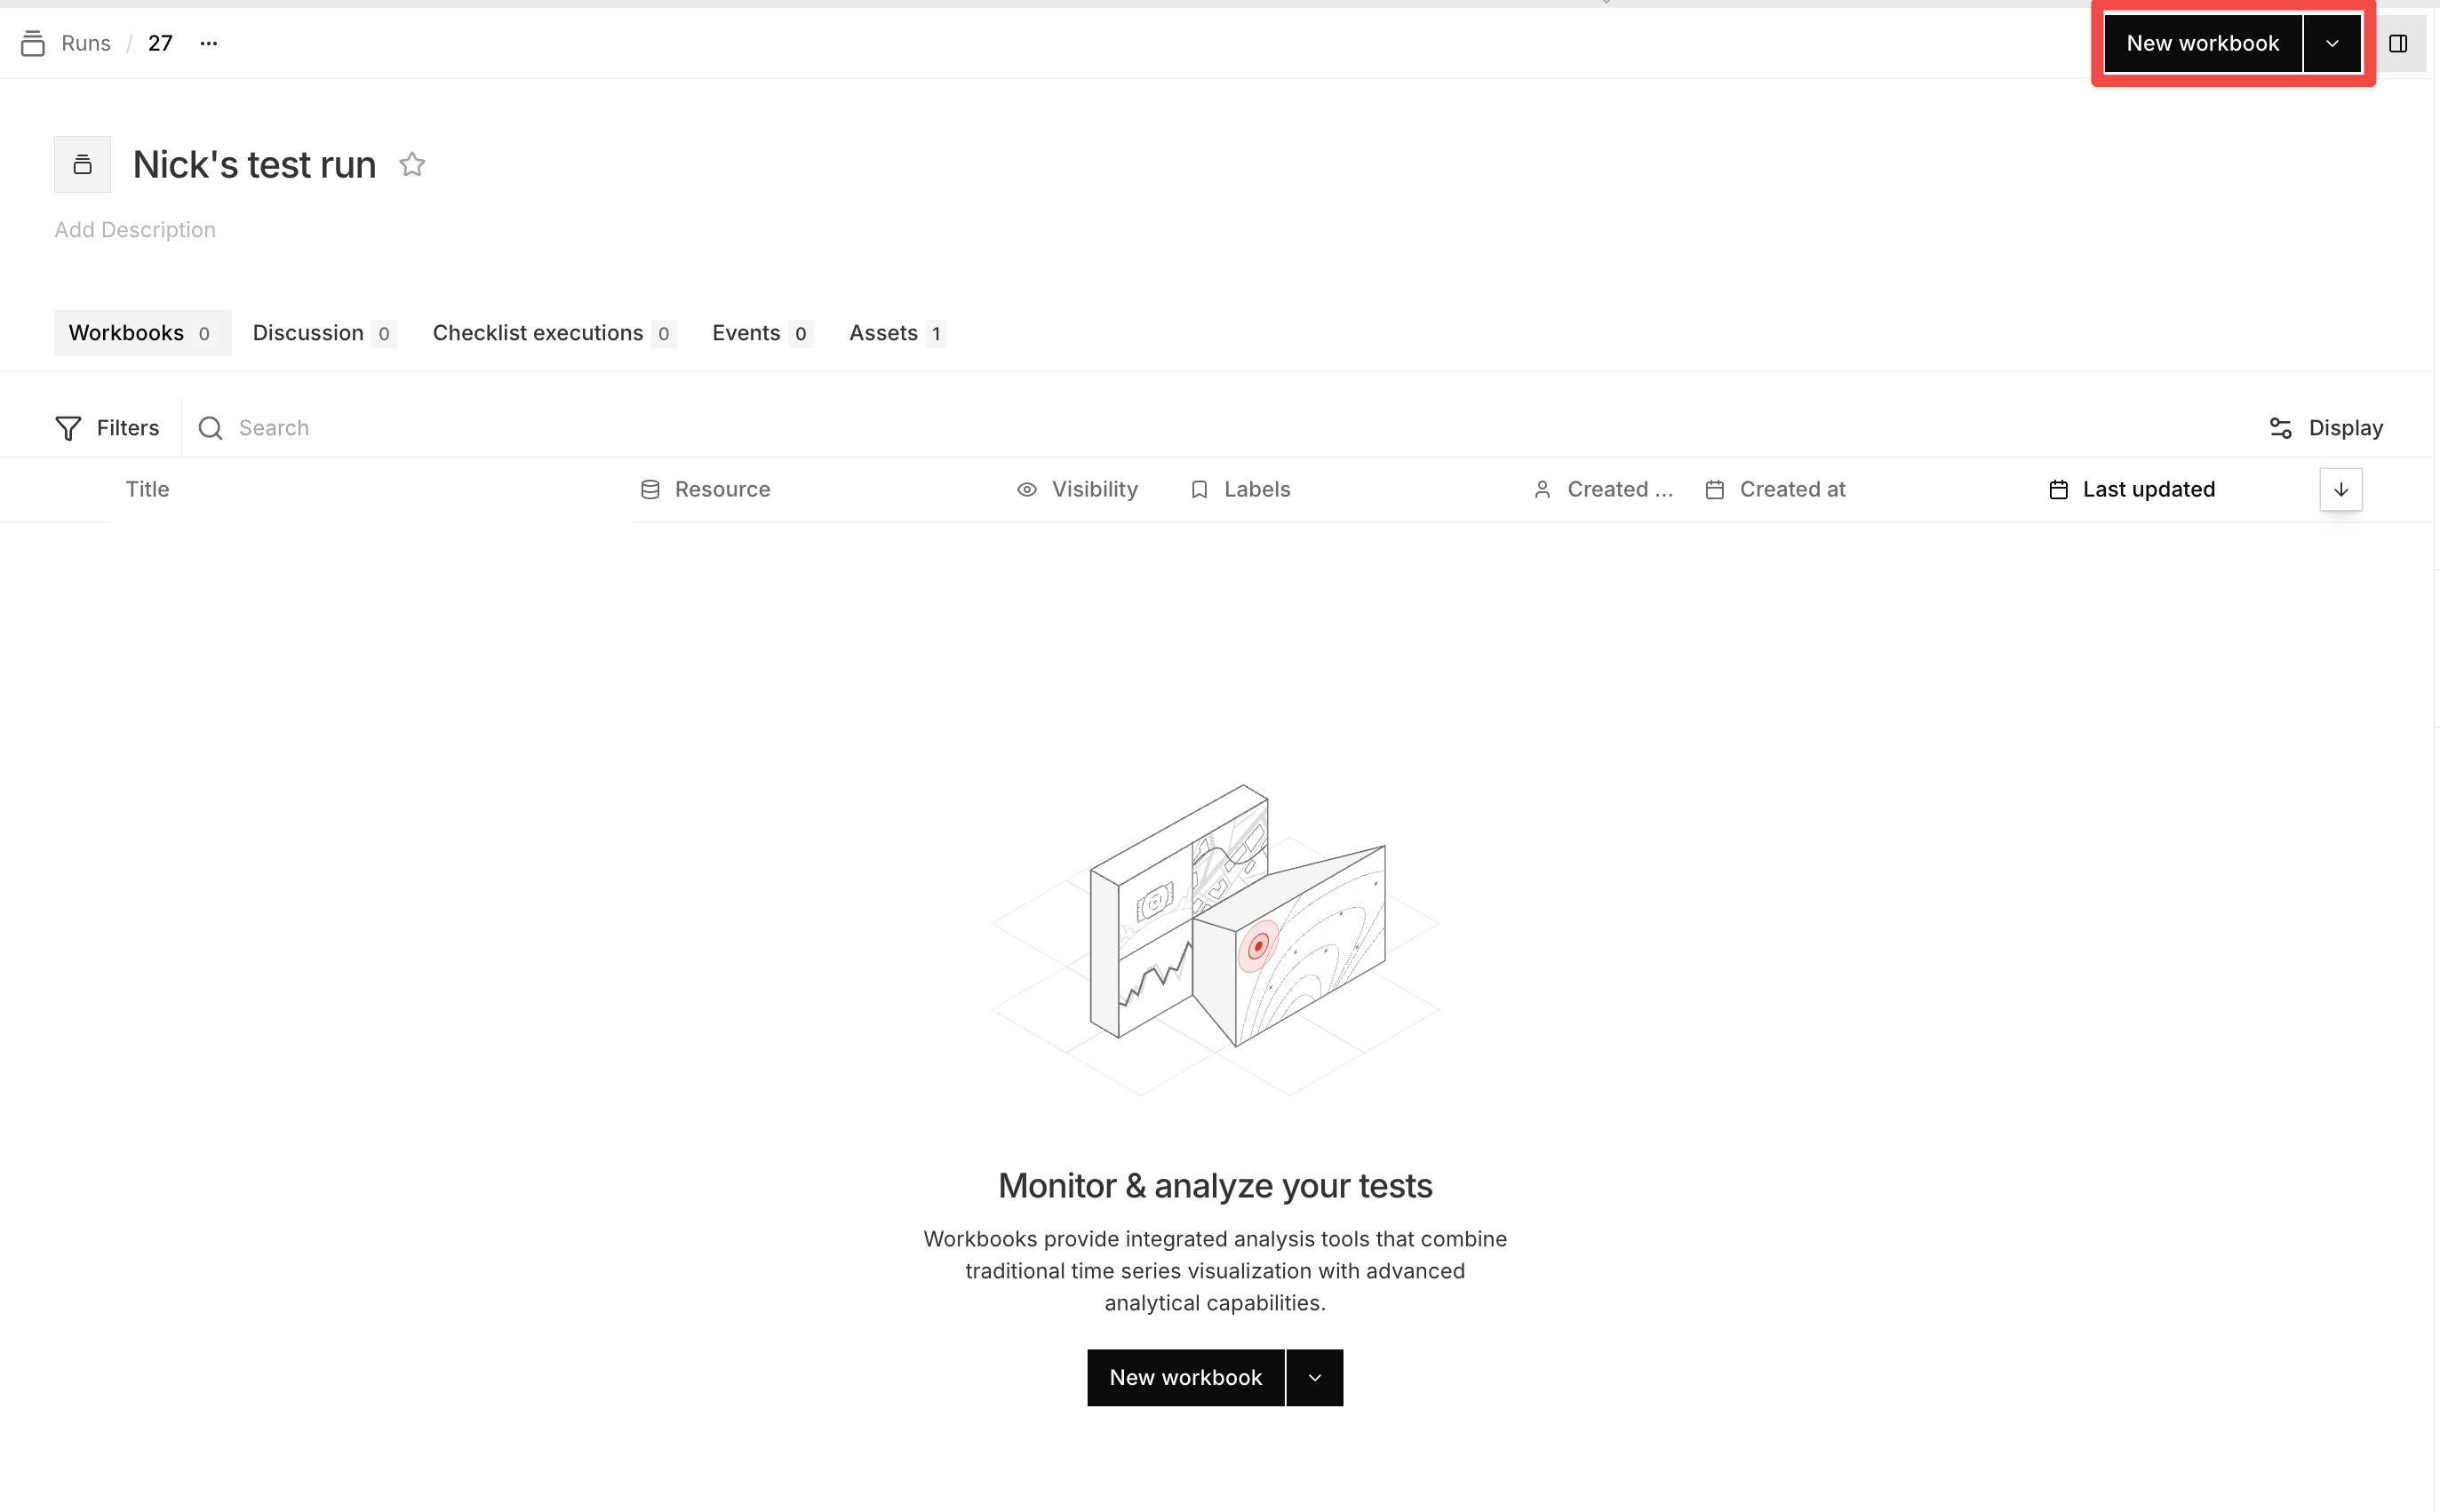
On the run’s page, click NEW WORKBOOK.
Under CHANNELS, find your channels and drag them onto the canvas to create a time series chart.
To follow streamed data as new points arrive:
In the bottom bar, click GO LIVE. The button reads LIVE while the workbook streams. Click it again to stop.
Choose a time window from the dropdown beside it. The default is the last 30 seconds.
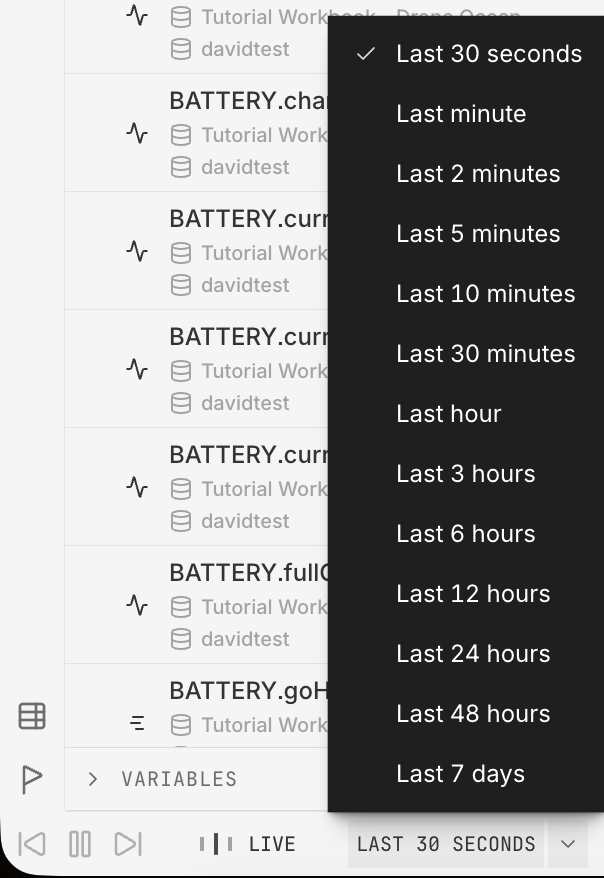
GO LIVE isn’t available if the workbook has time offsets, if all of its runs have ended, or if its data source can’t stream, such as an external database connection.